


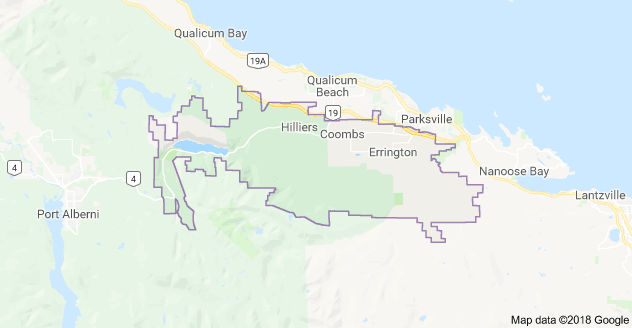
Unorganized Nanaimo Area F, a census area delineated for the first time in the 2001 census, including the designated places Errington, Coombs, and Hilliers, is inland from the Parksville Census Agglomeration (made up of Parksville, French Creek, and Qualicum Beach). On the eastern foot hills of Mount Arrowsmith, many people are involved in agriculture, industrial, commercial enterprises, as well as retail, growing to accommodate urbanites (traveling from the core areas - Vancouver, Seattle, and Victoria) to low density areas on the west coast of Vancouver Island (Tofino, Pacific Rim National Park, Ucluelet). Where is this area heading on current demographic trends?
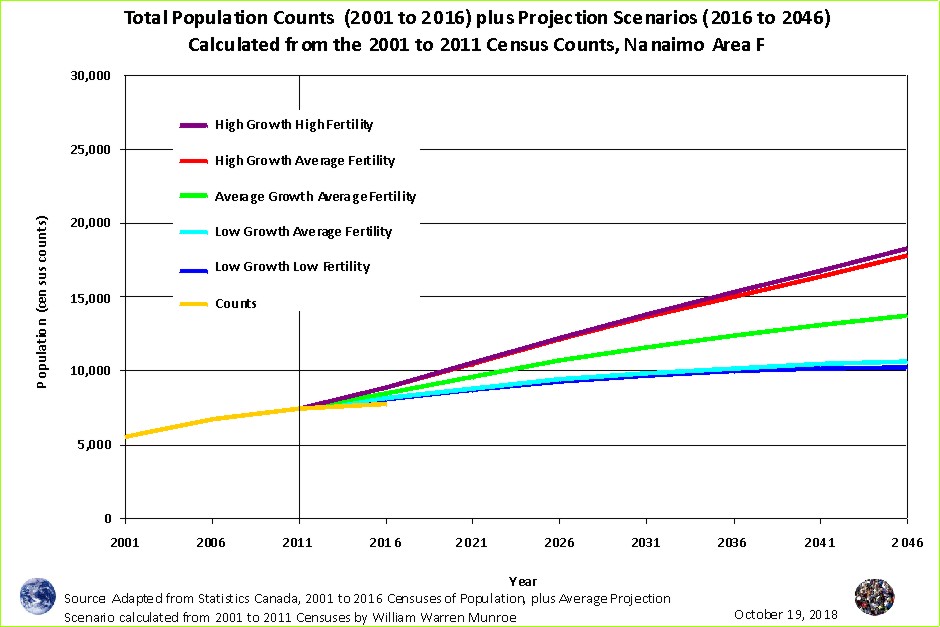
Over the 15 years between 2001 to 2016 (the gold line), total population increased from approximately 5,500 to 7,750 people according to Canada's Census of Popualtion, with an estimated 5 to 10% undercount calculated by Statistics Canada (see endnotes).
The rapid population growth between 2001 to 2006 of 20% slowed to just 4% between 2011 to 2016, well below the previous census periods. If the average growth experienced between 2001 to 2011 had continued (the green line), the total population would have reached approximately 8,500 people in 2016, ~750 more than counted during the 2016 census. This recent slower growth in Area F bucks the trend seen for the Nanaimo Regional District as a whole. A look at the age distribution for each of the censuses reveals which age groups changed the most and the least.
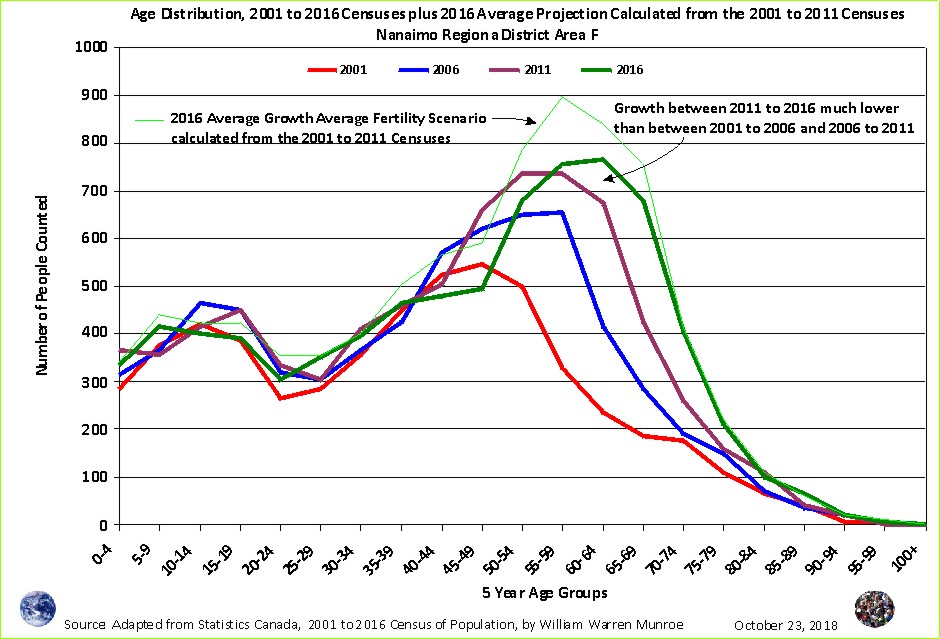
The Age Distribution chart (Figure 2) includes the Average Scenario calculated from the 2001 to 2011 censuses (the thin light green line) to provide a comparison between what was expected if the trends between 2001 and 2011 had continued and the actual 2016 census age counts.
Between 2001 and 2011, the 40 to 55-59 age groups saw relatively large increases, but this petered out in the most recent census period. The chart shows that the younger age groups were much more tightly woven - not much difference between one census and the next.
The Population Change Signature (Population Signature) represents the actual differences between the number of people counted in one 5 year age group in one census and the number counted in the next 5 year age group during the next census - if no one moved nor died, the number of people counted in the next 5 year age group during the next census would be the same - no difference.
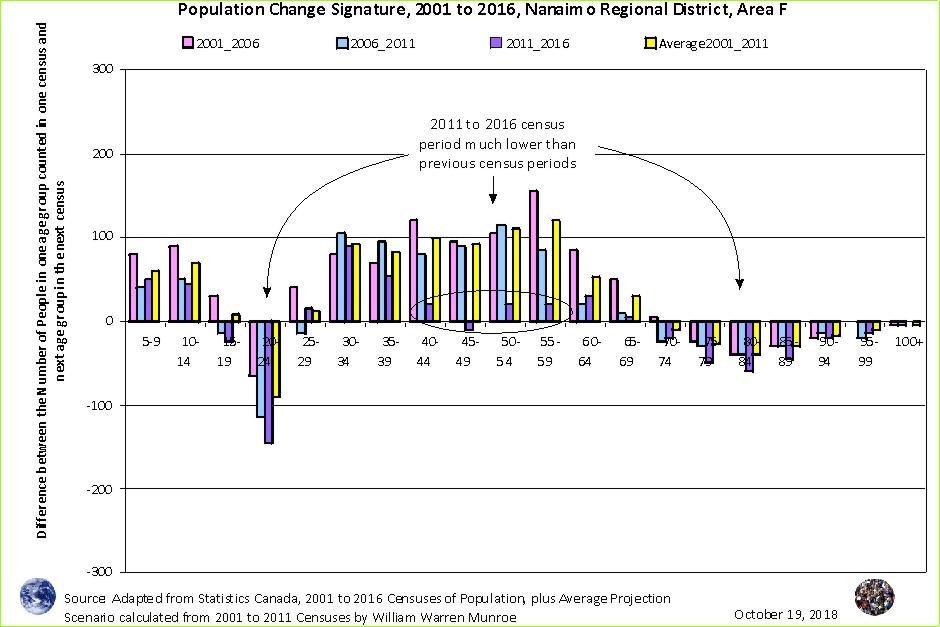
Nanaimo Area F's Population Signature includes a yellow bar for the average change calculated from the 2001 to 2011 censuses highlighing the remarkablely lower numbers for people 40 to 59 years of age as well as the greater out-migration for the 20 to 24 year olds.
The people 5 to 14 and 30 to 39 years of age were much more similar supporting the idea that young families are still attracted to the area, while older families appear to be less attracted (fewer may be moving in and or more are moving out).
Using the 2001 to 2016 censuses to calculate several well-defined population projection scenarios to 2046 (Figure 4 below), the future (if current trends over these years continue) total population scenarios look different then calculated from 2001 to 2011 alone (Figure 1).
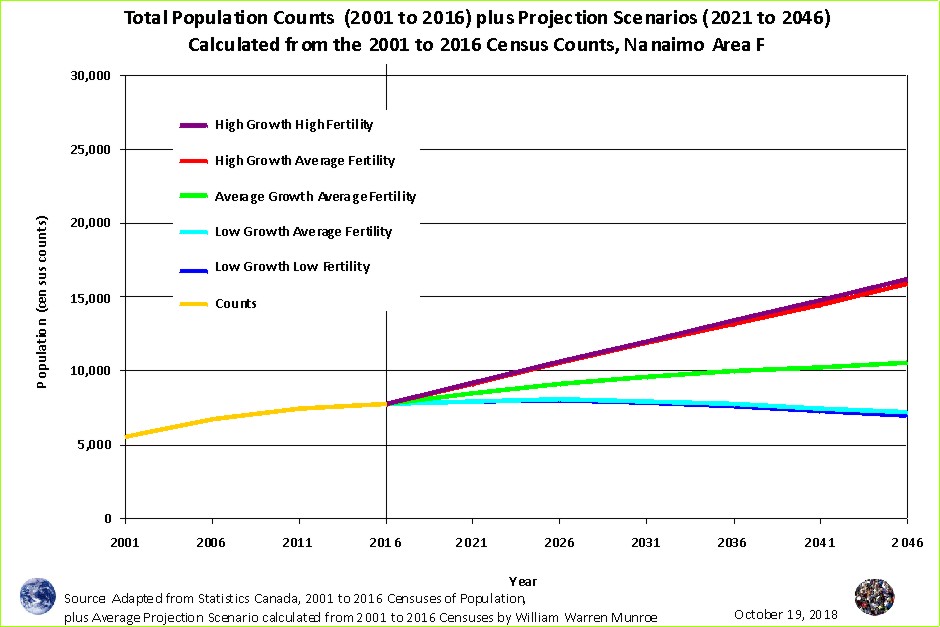
By including the most recent census period all the scenarios are lower than those in Figure 1. The Average scenario here (in Figure 4) is around the same as the lowest scenario in Figure 1 (10,500 vs 10,265 respectively). If the growth between 2011 to 2016 were to continue for the next 30 years (to 2046) the total population would begin to decline in the next 10 to 15 years (2026 to 2031) as the boomers age into the high mortality years 70+.
The absence of the 1996 census makes this population analysis different from others in this series; therefore, this analysis of the Census of Population should not be compared with other areas without pointing out this important difference.
The Nanaimo Regional District total population increased over 5% (~10,000 people) between 2011 and 2016 with more people for each age group under 50 years of age than expected (calculated from the 1996 to 2011 censuses - the 1996 to 2001 census period pulled the average scenario down marginally). Nanaimo Area F, like Qualicum Beach did not share in the above average growth in the number of people in these age groups.
Why? What do you think the future will look like? How come?
1 Google Maps (Nanaimo Area F)
2 Source: Statistics Canada - 2016 Census. Catalogue Number 98-400-X2016001. Go to Statistics Canada's Census Program website where you can navigate to 2016 Census of Population and download these numbers. Census Catalogue Number 98-400-X2016004, (2016 released May 3, 2017). Dwelling: 98-400-X2016021_English_CSV_data
2016 Global non-response rate (GNR) = 5.5%
To learn how the projections are created visit the Population Projection Project Instructions tab.
See the Nanaimo Area F Population Projections Project
See the Population Projections Project for Canada's Census Areas


