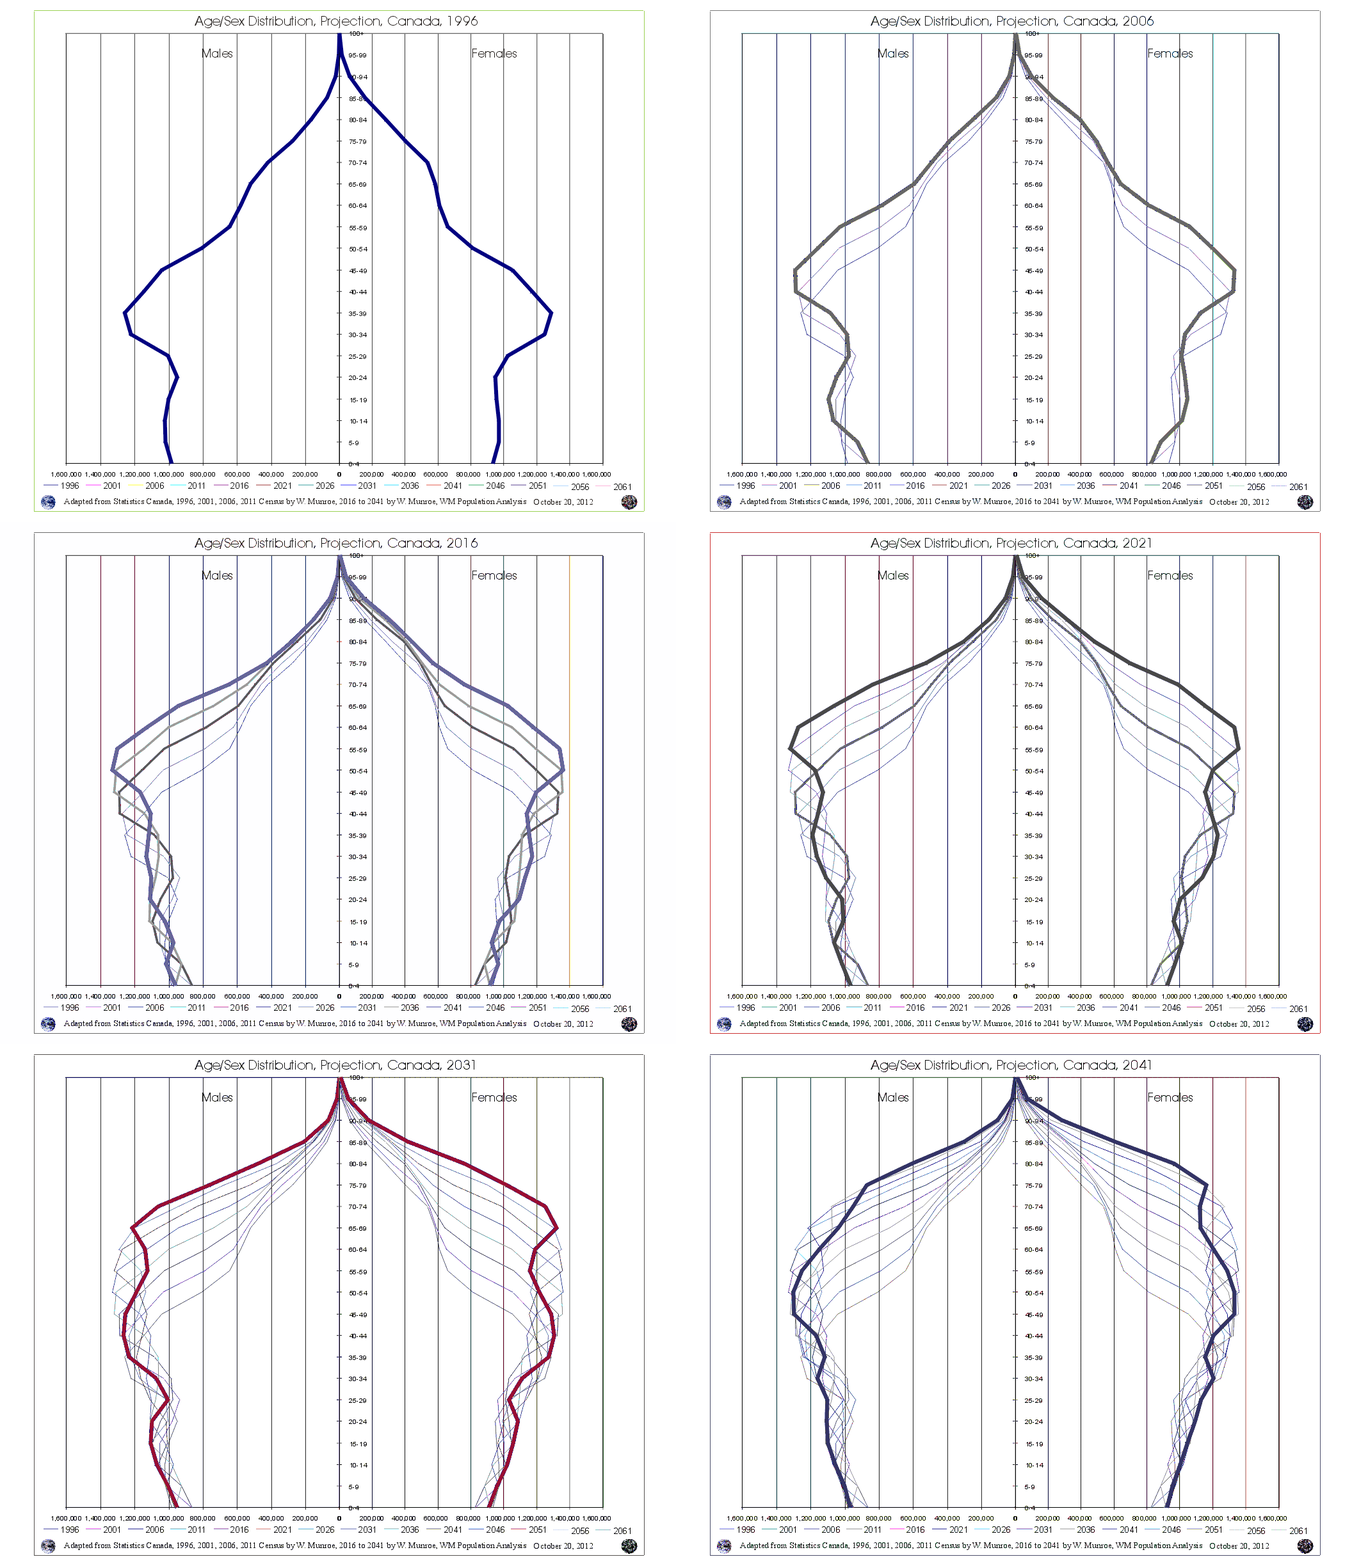
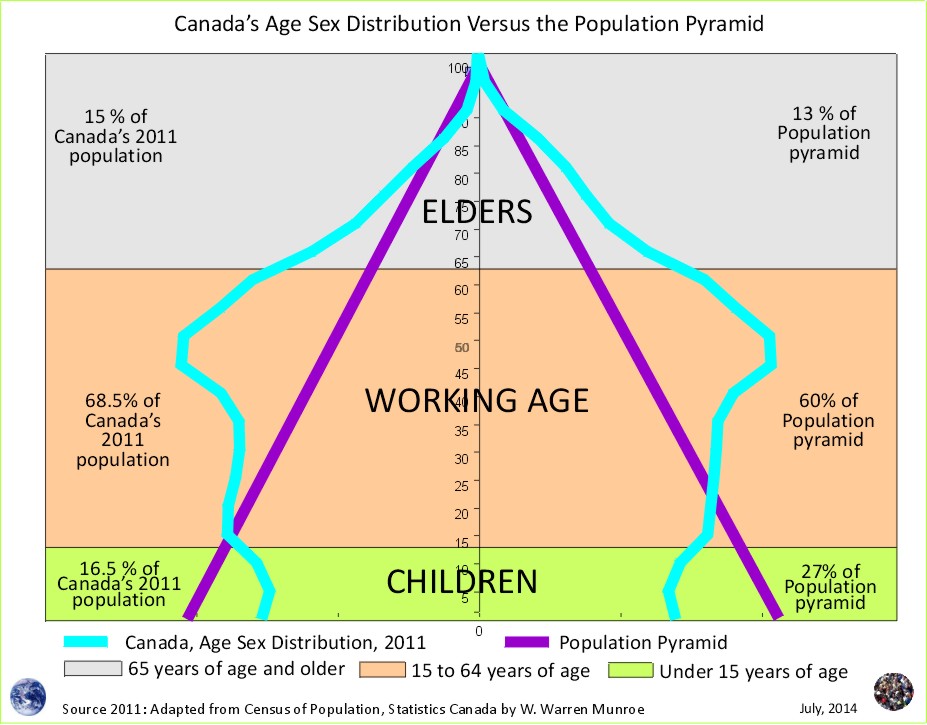
The following is a revision of an letter sent to the editor of the local paper (not printed) with the addition of an explanation of why government and bureaucracies did not report the latest baby boom including the firing of a Statistical Agency Analyst who raised concerns about non-statistical and substandard methods to create population numbers.
Sir,
Not only did the School District 69 administration withhold the methods and data that should have accompanied the lowered enrolment forecast used to justify closing of 4 of 15 public schools, but the provincial government’s Official Statistical Agency, BC Statistics, did this as well.
For over a decade, BC Statistics Officials provided incorrect methods and data to accompany unfounded population numbers - numbers that could not be replicated.[1] A spokesperson for ServiceBC asserted this to be acceptable because a Statistics Canada feasibility study found BC Stats’ population numbers to be of "better quality" than Statistics Canada’s.[2]
After many requests for a copy, or at least the title of the quoted feasibility study were ignored, a freedom of information request was made but denied claiming "disclosure harmful to intergovernmental relations or negotiations".[3]
Being an organization with integrity, Statistics Canada sent a copy of the study where in it was discovered BC Statistics’ Officials provided false reports for the feasibility study entitled "The Equalization Program and the Property Tax Base: Feasibility Study Conducted by Statistics Canada".[4]
Like parents/guardians and concerned citizens, Statistics Canada did not verify that correct methods and data accompanied the population numbers, but rather, accepted BC Statistics' false information in good faith. Having been deceived, Statistics Canada Officials endorsed BC Statistics’ methods as being of "better quality" and this was used to dismiss concerns raised about school enrolment forecasting.
Statistics Canada has implemented formal policies and clear accountabilities to safeguard against the "intrinsic risks" and "danger of monopoly", i.e. where a small group of people move into positions of government authority and may act without integrity. Safeguards include external review and verification to ensure correct methods and data accompany ‘findings’ rather than incorrect methods and data accompanying unfounded numbers.[5]
How can we intelligently participate in setting local to provincial priorities if we are to refer to unfounded numbers including unfounded enrolment forecasts? British Columbians can be served better.
William Warren Munroe
Former BC Statistics Economist, Population Analyst (2002 - 2006)
Population Projections Project for Canada’s census areas
wminfomatics.com/PopGeog/articles.html
Qualicum Beach, BC
250-947-5104
[1] In 2010, a consultant’s report recommending the closure of 4 of 15 public schools in a School District, pointed readers to BC Statistics' website where it was stated that BC Statistics uses methods and data described in a 1998 GENERALIZATION ESTIMATION SYSTEM (GES) Small Area Population Estimation, Method and Error Evaluation paper. Having served as Population Analyst for the Provincial Government of British Columbia, I knew the methods and data had changed many times since 1998; therefore, I wrote to BC Statistics asking why the 1998 GES paper had not been revised and published. I was told by the Executive Director of BC Statistics that a "long overdue" revision would be published in August 2011. Some, but not all, of the many changes that occurred between 1998 and 2011 were described on page 8 of the revised 2011 GES paper, where it states, for example, that telephone landline (Telus) data was adopted as an indicator of population change in the year 2000. BC Statistics Officials could have told readers that the methods had changed and a revised methods paper would be published soon but chose instead to point readers to methods that had not been used for over 10 years.
I have also explained that I was asked in 2002 to find out why the 1998 methods and data described in the 1998 GES paper produced inaccurate population estimates that were very different from the actual 2001 census results (released in 2002). I figured out why and this information was used by supervisors to change the 1998 methods. Therefore, the 1998 methods did not work. Years after being fired, I discovered that BC Statistics Officials had also deceived Statistics Canada and Finance Canada explained in this video https://www.youtube.com/watch?v=Kq9lgCydTj0
[2]Betty Jo Hughes, Assistant Deputy Minister, Ministry of Labour, Citizens’ Services, and Open Government, November 22, 2011. www.wminfomatics.com\WManalytics\Articles\140329\QSDFR_PPP_7.html
[3] Cindy Elbahir, Manager, Central Agency Team, Information Access Operations, June 22, 2012 www.wminfomatics.com\WP\Articles\120622\FOI_STC_Finance.pdf
[4] Go to page 63 of the 2005 feasibility study, "The Equalization Program and the Property Tax Base: Feasibility Study Conducted by Statistics Canada", (www.wminfomatics.com\WP\Articles\120618\conclusions_to_finance.pdf) where it states that BC Statistics uses the 1998 GENERALIZATION ESTIMATION SYSTEM (GES) methods and data and that by using this 1998 method and data, BC Statistics' Population Section members created population numbers that nearly exactly matched the 2001 census results (released in 2002); therefore, BC Statistics Officials did not reveal that the 1998 methods and data produced unacceptable population estimates nor did they reveal that during the feasibility study in 2004 to 2005, Telus data was being used.
The BC Statistics' Population Section Chief Demographer who was given the manager position, Dave O'Neil, who had flown to Ottawa for meetings with Statistics Canada (September 2004), falsified information for the equalization payments feasibility study thereby deceiving Statistics Canada Officials.
Mr. O’Neil took the new Population Analyst, Jennifer Hansen, with him to Ottawa for the meetings with Statistics Canada Officials. If I had gone, O’Neil would not have been able to deceive Statistics Canada representatives.
Years later, I presented some of my work at the "Methods for Projections" session at the 2013 Congress organized by the Federation of Humanities and Social Sciences. In the audience of approximately 20 to 30 people were O’Neil and Hansen. I described why the Population Projections Project was developed including the "disclosure harmful" claim. No wonder O’Neil and Hansen turned red and shifted nervously back and forth in their chairs during my presentation. Jennifer Hansen quickly exited immediately after my presentation. O’Neil did not comment nor say anything even during question period.
Now I know why I was removed from the contacts list and accused of making my co-worker (Hansen) feel unsafe and denied mediation or any way to resolve the accusation, and ordered to turn in my security pass and "escorted" out of the building shortly after I submitted a grievance to the Deputy Minister.
A week later, I was ordered to return to work but registered in a program for employees with work problems believed to be due to personal problems. I was also to have an "assessment" of a believed behavioural problem - not being able to control ones behaviour. For insisting on mediation rather than go down this inapplicable channel, I was dismissed by the Deputy Minister, Gordon Macatee for insubordination and denied arbitration for what the BC Public Service Agency claimed as going down the wrong channel. Little wonder Premier Clark described the Capital of BC, Victoria, as having a "sick culture".
See the summary of my presentation at the 2013 Congress organized by the Federation of Humanities and Social Sciences, Methods for Projections session hosted by the Canadian Population Society (4 pages with illustrations) www.wminfomatics.com\PopulationProjections\CPS_PPP_Validate.pdf
[5] www.wminfomatics.com \WP\ANALYTIC_ACTIVITIES_AT_STATISTICSCANADA.pdf
To learn how the projections are created visit the Population Projection Project Instructions tab.
Population Projection Project for Canada's Census Areas
"Population Projections Project Scenarios Compared To 2016 Census Of Population" Part 1: Are the demographic trends between 1996 and 2011 continuing? February 8, 2017
"Are the Population Projections Project Scenarios Accurate?" September 30, 2016
"With One Of The Best Statistical Agencies In The World, Canadians Have Fundamental Misunderstandings About Demographics Trends". October 20, 2016
"Possible Cures, Possible Futures For An 'Unhealthy' Culture". November 7, 2014 (Updated November 19)
Why are Statistics Canada's projections so high compared to the United Nations and the Cohort Change Ratios projections? Read Why so different?
Government population projections for BC reflect an "up and to the right" aspiration, while the cohort change ratios method shows BC's population growth slowing, and levelling out. Read a "A Comparison of Population Projections for BC"...


