
The Population Projections Project (PPP) has proven to be a reliable and useful reference with which to be aware of where we are and where we are heading on current demographic trends.
The 2021 Census of Population total counts for Canada as a whole came in at just under 37 million people (36,991,981) (February 9, 2022 Statistics Canada)1.
How does this result compare with the Population Projections Project's (PPP) 5 population projection scenarios calculated directly from Canada's 1996, 2001, 2006, 2011, 2016 Censuses of Population?
We are interested in whether the demographic trends seen in the censuses over the last 25 years are similar to the current 2011 to 2016 trends.
In particularly, is the 2021 Census total population count for Canada between the PPP's high and low scenarios (similar to the growth between 1996 and 2021), or is it higher or lower?
In view of the fact that Canada experienced a down-turn in economic activity along with relatively slow population growth between 1996 and 2001, a down-turn not seen since for Canada as a whole, we should expect slightly higher than average total population for 2021.
Let's take a look.
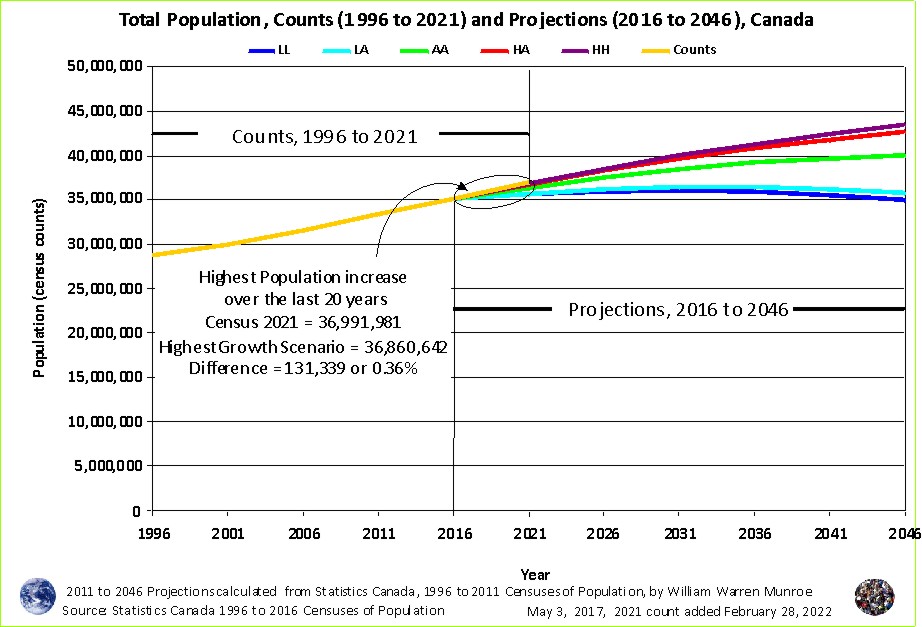
Figure 1 shows the 2021 Census count (36,991,981) is slighlty higher than the Highest growth Highest Child Women Ratio (HH) scenario (36,860,642) - a difference of 131,339 people or 0.36%. The average growth scenario calculated from the 1996 to 2016 censuses was 36,413,060 or nearly 600,000 people difference (578,921 or 1.6%).
The downturn in economic activity seen between 1996 to 2001 has yet to be repeated since. Low interest rates and quantitative easing may (likely) have something to do with the continued relatively high population growth in Canada. Also, the increases in international in-migration if continued, could result in Canada's total population (~45 million) rising well above the average scenario that shows a leveling off of Canada's population around 40 million.
The high growth is a result of either more births than deaths, and or more international in migration than out migration. The Federal government, directed by the Liberal Party, has increased to the annual quote for in-migration to Canada from ~250,000 to ~400,000 people per year since 2015.
This change resulted in population increase (more in than out migration) initialy but was slowed due to another in a long line of pandemics designed mostly to increase the market for injections enforced with government quarentines of healthy people, restricting travel etc.
The 5 possible population projection scenarios more fully explained:3
1) HH - highest growth census period (from 2006 to 2011 for Canada) and the census year with the highest number of children under five relative to the number of females 20 to 39 years of age (2011) = 36,860,642
2) HA - highest growth census period (from 2006 to 2011 for Canada) with the average number of children under five relative to the number of females 20 to 39 years of age (1996, 2001, 2006, 2011, 2016) = 36,517,492
3) AA - average growth census periods (from 1996 to 2016) with average number of children under five relative to the number of females 20 to 39 years of age (1996, 2001, 2006, 2011, 2016) = 36,413,060
4) LA - lowest growth census period (from 1996 to 2006) with average number of children under five relative to the number of females 20 to 39 years of age (1996, 2001, 2006, 2011, 2016) = 36,300,187
5) LL - lowest growth census period (from 1996 to 2001) and the census year with the lowest number of children under five relative to the number of females 20 to 39 years of age (2001) = 35,629,956
Of course there is some error in each census; therefore, care should be taken when saying what something is or isn't.
The age sex counts to be released in April this year may shed light on these issues.
What will the age distribution projection scenarios for 2021 look like?
What do you think?
1 Source:
Statistics Canada - 1996 Census. Catalogue Number 95F0181XDB96001;
Statistics Canada - 2001 Census. Catalogue Number 95F0300XCB2001006;
Statistics Canada - 2006 Census. Catalogue Number 97-551-XCB2006011;
Statistics Canada - 2011 Census. Catalogue Number 98-311-XCB2011018;
Statistics Canada - 2016 Census. Catalogue Number 98-400-X2016004. Global non-response rate (GNR) = 4%
Statistics Canada. Table 98-10-0001-01 Population and dwelling counts: Canada, provinces and territories
Adapted from Statistics Canada's Censuses of Population with 2021 to 2046 projection scenarios by William Warren Munroe
NOTE FROM STATISTICS CANADA
Content considerations by Statistics Canada
The 2021 Census population counts for a particular geographic area represent the number of Canadians whose usual place of residence is in that area, regardless of where they happened to be on Census Day. Also included are any Canadians who were staying in that area on Census Day and who had no usual place of residence elsewhere in Canada, as well as those considered to be non-permanent residents. For most areas, there is little difference between the number of usual residents and the number of people staying in the area on Census Day. For certain places, however, such as tourist or vacation areas, or those including large work camps, the number of people staying in that area at any particular time could significantly exceed the number of usual residents shown here. The population counts include Canadians living in other countries, but do not include foreign residents living in Canada. Given these differences, users are advised not to interpret population counts as being the number of people living in the reported dwellings.
The dwelling counts refer to total private dwellings and private dwellings occupied by usual residents in Canada. The census dwelling counts do not include collective dwellings, which are dwellings of a commercial, institutional or communal nature. The usual residents in collective dwellings are, however, included in the population counts.
Changes occur to the names, boundaries and other characteristics of geographic areas (e.g., census subdivisions may amalgamate, or there may be an annexation or a change of name or status). Since the geographic framework is used for census data collection, the geographic reference date must be set several months before the date of the census in order to have these changes made in time. For the 2021 Census, the geographic reference date was January 1, 2021.
Land area is the area in square kilometres of the land-based portions of standard geographic areas. The data are unofficial, and are provided for the sole purpose of calculating population density. Land area data for the standard geographic areas reflect the boundaries in effect on January 1, 2021 (the geographic reference date for the 2021 Census of Canada).
Definitions
The Census Dictionary is a reference document which contains detailed definitions of Census of Population concepts, universes, variables, and geographic terms, as well as historical information.
Incompletely enumerated reserves and settlements
In 2021, a total of 63 census subdivisions defined as reserves and settlements were incompletely enumerated. For these reserves and settlements, dwelling enumeration was either not permitted or could not be completed because of the various reasons below.
This represents an increase compared with the 14 census subdivisions defined as reserves and settlements that were incompletely enumerated in the 2016 Census. Health and safety restrictions put in place to slow the spread of COVID-19 and natural events (including evacuations because of forest fires) contributed to the incomplete enumeration of many reserves and settlements.
The 2021 Census population and dwelling counts are not available for the 63 incompletely enumerated reserves and settlements, and are not included in 2021 Census tabulations. Data for geographic areas containing one or more of these reserves and settlements are noted accordingly. Because of the missing data, users are cautioned thatfor the affected geographic areascomparisons (e.g., percentage change) between 2016 and 2021 may not be precise. The impact of the missing data for higher-level geographic areas (Canada, provinces and territories, census metropolitan areas and census agglomerations) is usually very/ small. However, the impact can be significant for lower-level geographic areas (e.g., census divisions), where incompletely enumerated reserves and settlements account for a higher proportion of the population. This is especially true for lower-level geographic areas where a particular reserve or settlement was incompletely enumerated for the 2021 Census but enumerated for the 2016 Census and, vice versa.
Adjustment of population counts
Statistics Canada is committed to protect the privacy of all Canadians and the confidentiality of the data they provide to us. As part of this commitment, some population counts of geographic areas are adjusted in order to ensure confidentiality.
Counts of the total population are rounded to a base of 5 for any dissemination block having a population of less than 15. Population counts for all standard geographic areas above the dissemination block level are derived by summing the adjusted dissemination block counts. The adjustment of dissemination block counts is controlled to ensure that the population counts for dissemination areas will always be within 5 of the actual values. The adjustment has no impact on the population counts of census divisions and large census subdivisions. Dwelling counts are not adjusted.
Difference between census counts and population estimates
The Census of Population is designed to conduct a complete count of the population. Inevitably, however, some individuals will not be enumerated (undercoverage), while others, usually less numerous, will be enumerated more than once (overcoverage).
To determine the number of people who were missed or counted more than once, Statistics Canada conducts postcensal studies of the coverage of the census population, using representative samples of the population. Results of these studies are usually available two years after Census Day. They are used, in combination with census figures and other sources, to develop the population estimates produced by Statistics Canada on a regular basis. Population estimates are used for equalization payments, to follow trends in the Canadian population on a quarterly basis and to understand the underlying components of population change (for example, births, deaths, immigrants, emigrants and non-permanent residents). Population estimates differ from census counts and are usually higher, because census counts are not adjusted for undercoverage or overcoverage.
2The Fauci/COVID-19 Dossier
This document is prepared for humanity by Dr. David E. Martin.
Forum on Medical and Public Health Preparedness for Catastrophic Events; Forum on Drug Discovery, Development, and Translation; Forum on Microbial Threats; Board on Health Sciences Policy; Board on Global Health; Institute of Medicine; National Academies of Sciences, Engineering, and Medicine. Rapid Medical Countermeasure Response to Infectious Diseases: Enabling Sustainable Capabilities Through Ongoing Public- and Private-Sector Partnerships: Workshop Summary. Washington (DC): National Academies Press (US); 2016 Feb 12. 6, Developing MCMs for Coronaviruses. Available from: https://www.ncbi.nlm.nih.gov/books/NBK349040/
3 "A Short Method for Projecting Population by Age from One Decennial Census to Another" C. Horace Hamilton and Joseph Perry, Social Forces, VOl. 41, No. 2 (December 1962), p. 164.
The Hamilton Perry method is very similar to the Population Projections Project method - using cohort change ratios. Developed completely independent of the HP method, the PPP was released in 2012 (initial experimentation began in 2007). The PPP was designed to help anyone interested in current demographic trends and how to calculate population projection scenarios by age and sex. For example, people who were asking how tax funded enrolment forecasts were created, used to justify school closures. We found that the provincial statistical agency disseminated incorrect methods and data accompanying unfounded, baseless population numbers for over 10 years.
The PPP and the HP differ in several fundamental ways - the former using more than 2 censuses and it also calculates several well defined scenarios rather than one. The PPP also uses Child Women ratios directly calculated from the censuses benefiting from the 5 year censuses versus the 10 year censuses HP only had access to.
Learn how the projections are calculated for the Population Projection Project by following the steps under the Instructions tab.
Population Projection Project for Canada's Census Areas
"Population Projections Project Scenarios Compared To 2016 Census Of Population" Part 1: Are the demographic trends between 1996 and 2011 continuing? February 8, 2017
"Are the Population Projections Project Scenarios Accurate?" September 30, 2016
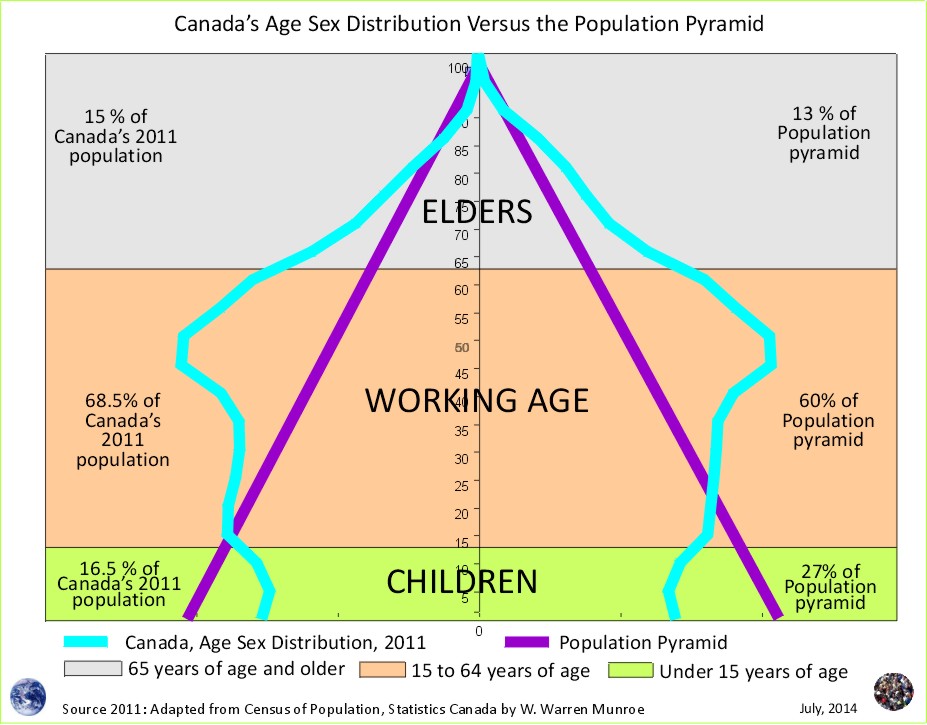
 Take a look at Canada's Age Sex Distribution animated projection (medium scenario). The animation starts at 1996 and clicks through to 2041. Notice in the 1996 chart, the baby boom bulge (which is just the resumption of more births than deaths - the population pyramid - after WW2) followed by fewer numbers in the younger age groups reflecting (resulting from) reduced fertility beginning in the mid 1960s. This medium scenario projection is an average of the 1996 to 2011 cohort change ratios thus creating a central tendency that eventually provides smooth lines in the younger age groups by the end of the projection period.
Why are Statistics Canada's projections so high compared to the United Nations and the Cohort Change Ratios projections? Read Why so different?
Government population projections for BC reflect an "up and to the right" aspiration, while the cohort change ratios method shows BC's population growth slowing, and levelling out. Read a "A Comparison of Population Projections for BC"...