


An hours drive inland from high density, expensive Vancouver, Chilliwack has received an increase in total population as people seek relatively affordable accommodation in a more rural setting.1
But who is attracted to Chilliwack, and who isn't: families, retirees, teens, 20 year olds? Are the numbers of the people in these broad age groups steadily growing or are they fluctuating? What proportion of the residents are in these age groups? What will the future look like if current demographic trends continue?
First though, how accurate are the numbers and how accurate are the projections of future population? Of course we cannot see into the future but we can compare projections created years ago with the most recent census counts. In other words, how accurate were the projection scenarios for Chilliwack for 2016 by agecalculated in 2012 (directly from the 1996 to 2011 censuses) when compared to the actual 2016 census results? Let's start with a look at what the 1996 to 2011 censuses age distributions may reveal.
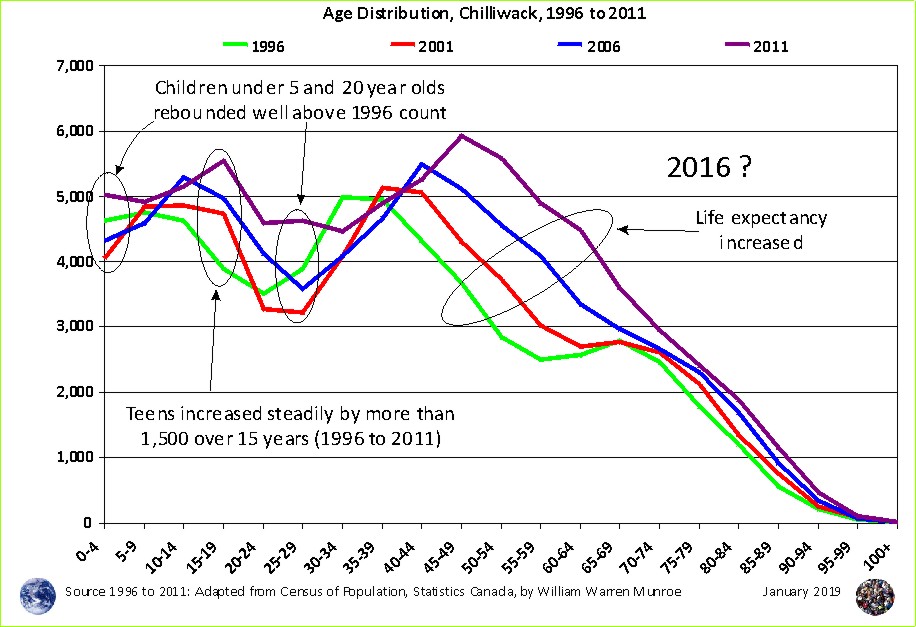
Adapted from Canada's Census of Population and Dwellings, Figure 1 shows us the age distribution for Chilliwack has changed substantially from 1996 to 2011. We can see that the number of young children (under 5 years of age) has increased well above the 1996 count, bouncing back strongly from the lows in 2001 and 2006. The number of teens and twenty years olds have also increased. The number of people in their late 40s have shot up with high in-migration and increased life expectancy continues to fill out the number of elders.
Referring to the change in the number of people by age from one census to the next we can easily calculate what the future will look like (not might look like) if current trends continue.
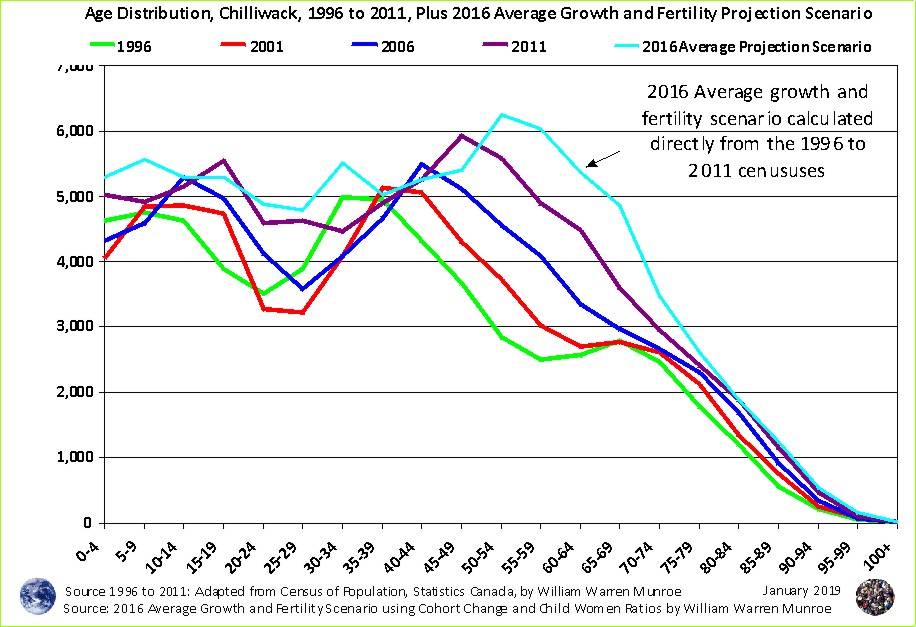
The Average Growth Average Fertility (Average) projection scenario calculated from the 1996 to 2011 censuses is added in Figure 2 - the cyan (light blue) line. While it looks reasonable at least for the older age groups (50+) the younger age groups are more convoluted. Since we have the benefit of the 2016 census (not every country has a census every 5 years - this makes Canada one of the best informed societies in the world) let's add the actual 2016 census counts by 5 year age groups to compare with the Average scenario.
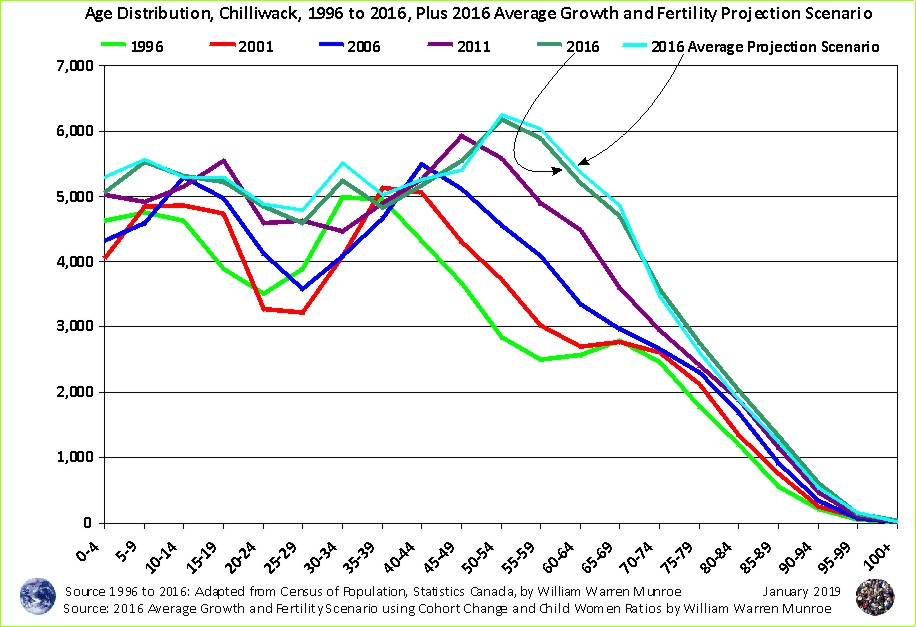
The 2016 census counts (the dark green line) are very similar to the 2016 Average projection scenario, (the cyan (light blue) line) calculated from the 1996 to 2011 censuses. Let's remove these earlier census counts to see the 2016 comparison more clearly.
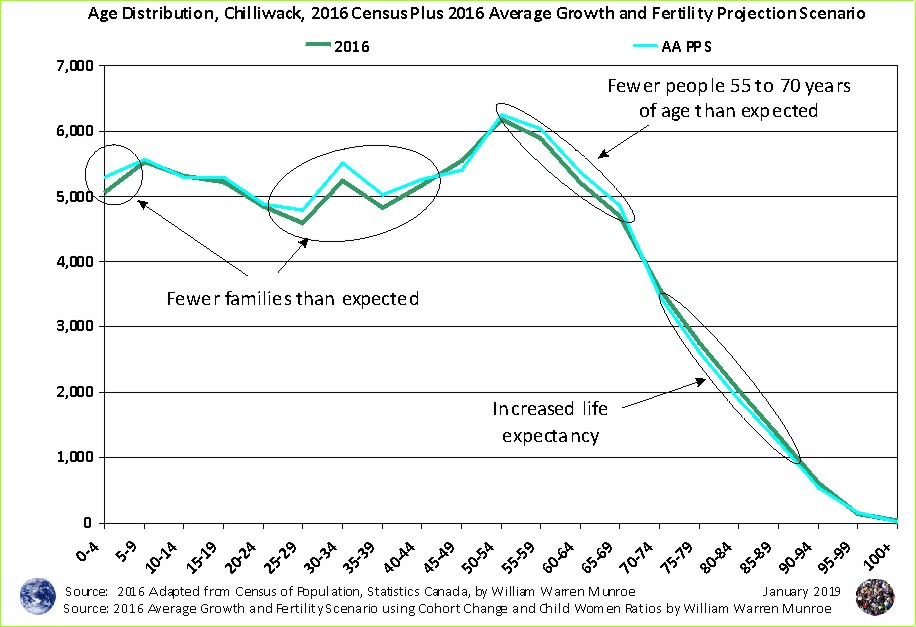
While very similar, the actual counts do differ from the Average scenario. Firstly, there were fewer people making up the family age groups particularly those under 5 and the 20 and 30 year olds - fewer than in the Average scenario (the average of the 1996 to 2011 censuses).
Also there were marginally fewer people 50 to 69 years of age but slightly more over 70 years pointing to the marginal increase in life expectancy. Otherwise the two lines, the census and the Average projection scenario are nearly identical.
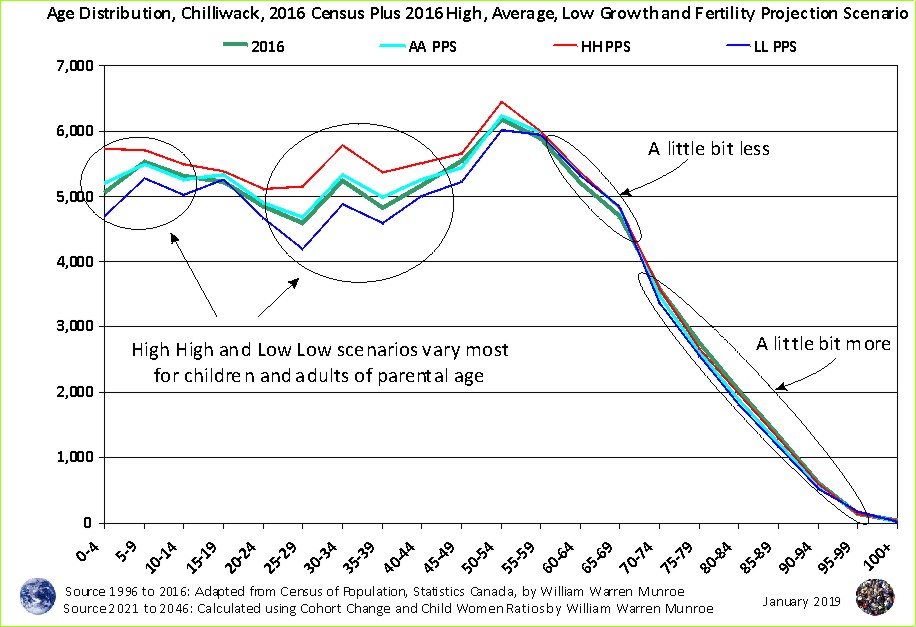
Now let's see if the 2016 census age distribution fell within the range of the highest and lowest trends reflected in the 1996 to 2011 census. We can do this because Chilliwack's population grew at different rates between these years (1996, 2001, 2006, 2011) as did the number of young children (under 5) relative to the number of females of child bearing age (15 to 44). Let's then add the High and Low growth scenarios.
Over the last 20 years (for which we have reliable information) demographic trends (fertility, life expectancy, and migration), Chilliwack has experienced considerable variation in population growth (slowest between 1996 and 2001, highest between 2006 and 2011) and fertility (lowest in 2001, highest in 1996).
The greatest variation between the High Growth High Fertility and the Low Growth Low Fertility scenarios was for the age groups that make up families (very roughly) - young children and adults 25 to 50 years of age.
All age groups fell within the High Growth High Fertility and Low Growth and Low Fertility ranges except for very slightly more 75+ age groups while there were very marginally fewer 60 year olds. The 15 to 19 year olds counts closely matched to Low scenario.
To summarize, the age distribution is not smooth and steady as she goes, but rather, has varied greatly over the last 20 years for which we have census data.
The topic of what the future will look like if current trends continue was addressed in the previous article and will be addressed again in this multi-part series on Chilliwack's demographic trends.
What do you think? What will the future will look like? How come?
1 Source: Statistics Canada - 2016 Census. Catalogue Number 98-400-X2016004 (2016 released May 3, 2017). Go to Statistics Canada's Census Program website where you can navigate to the 1996 to 2016 Censuses of Population and download these numbers.
2016 Global non-response rate (GNR) = 5.5 %
To learn how the projections are created visit the Population Projection Project Instructions tab.
See the Population Projections Project for Canada's Census Areas
The lines on the chart represent:
1) LL: Lowest Growth Lowest Fertility Scenario - calculated from the lowest growth census period (from 1996 to 2001) and the census year with the lowest number of children under five relative to the number of females 15 to 44 years of age (2001) - the BLUE LINE.
2) AA, Average Growth Average Fertility Scenario - average growth census periods with average number of children under five relative to the number of females 15 to 44 years of age - GREEN LINE.
3) HH: Highest Growth Highest Fertility Scenario - highest growth census period (2006 to 2011) and the census year with the highest number of children under five relative to the number of females 15 to 44 years of age (1996) - the RED LINE.
4) The actual 2016 Census counts - the DARK GREEN LINE.
Chilliwack's population growth slowed between 2011 and 2016, January 22, 2019
Chilliwack's population growth slowed between 2011 and 2016, February 12, 2019
Chilliwack's Child Women Ratios shift from teens to twenties, February 15, 2019
Chilliwack's Broad Age Groups and Dependency Ratios, 1996 to 2046, March 4, 2019