

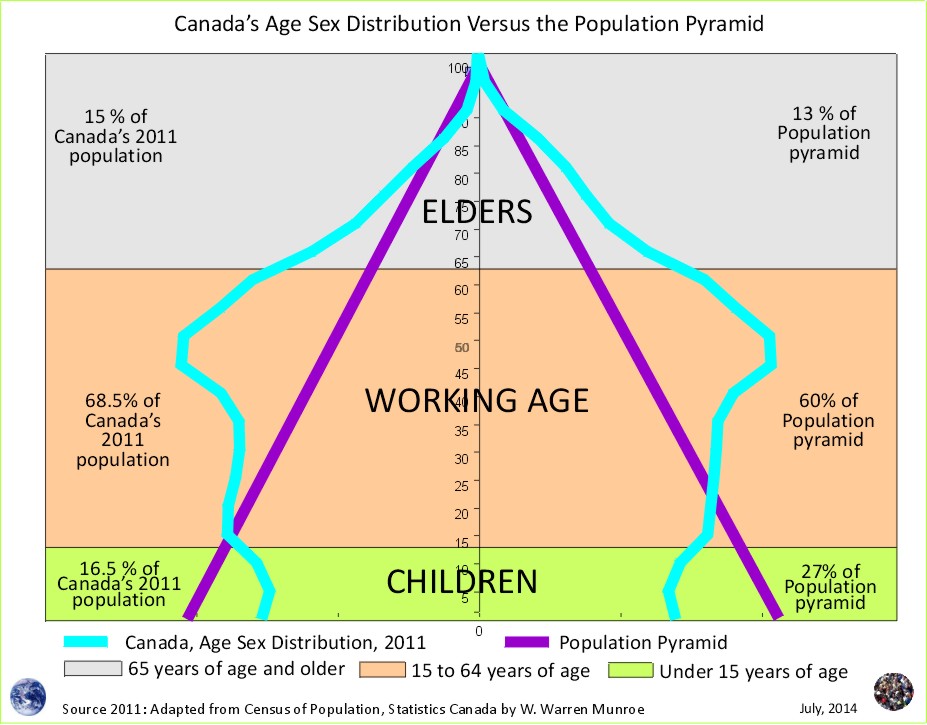

Approximately 100 kilometers inland from the Salish Sea, Chilliwack, on the banks of the mighty Fraser River, has grown rapidly over the 20 years from the 1996 to the 2016 census - from just over 60,000 to ~85,000 people. What does the future population look like if current demographic trends, trends in fertility, life expectancy, and migration, continue?
First though, let's see how accurate previous population projection scenarios for Chilliwack were when compared to the actual census results for 2016.
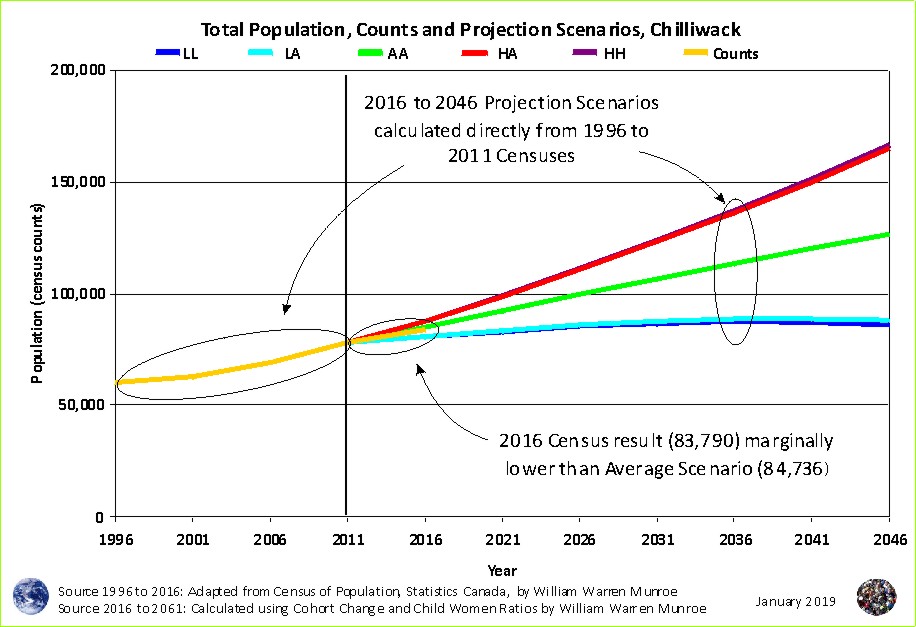
Figure 1 shows us that the population grew increasingly from 1996 to 2011 but grew more slowly from 2011 to 2016, marginally below the average population projection scenario calculated directly from the 1996 to 2011 Censuses of Population for Chilliwack. The 2016 census count was 83,790 compared to the Average Scenario of 84,736 approximately 1,000 fewer than expected or -1.1% lower.
Figure 1 also shows the Average Growth Average Fertility scenario calculated directly from the 1996 to 2011 Censuses projects a total population of ~125,000 people by 2046. What does the future look like taking into consideration the 2016 census results - the total population projection scenarios calculated directly from the 1996 to 2016 Censuses?
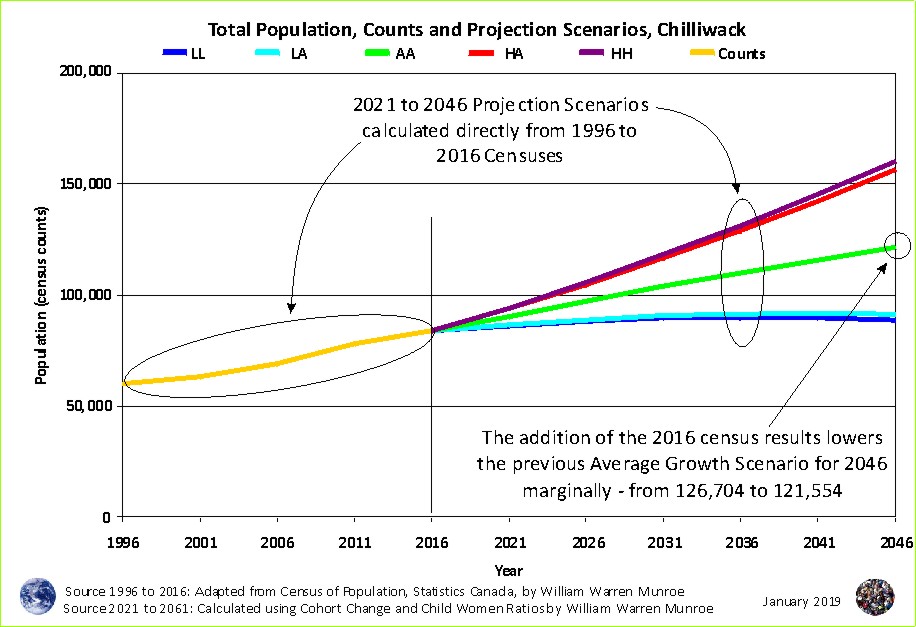
By 2046, the total population Average Growth Average Fertility scenario calculated using the 1996 to 2016 censuses is ~5,000 lower than that calculated using the 1996 to 2011 censuses. Of course this is more an numaric exercise simply to show that the most recent census results were lower than expected thereby bringing down the total over the next 30 years marginally.
Nonetheless, if current demographic trends continue, taking into consideration the variation in migration and fertility between 1996 to 2016, the total population will be between ~85,000 and ~160,000 by 2046. Keep in mind that the high scenario as well as the low scenario are both very unlikely, but given the nature of nature, things can change.
What do you think? What will the future will look like? How come?
1 Source: Statistics Canada - 2016 Census. Catalogue Number 98-400-X2016004 (2016 released May 3, 2017). Go to Statistics Canada's Census Program website where you can navigate to the 1996 to 2016 Censuses of Population and download these numbers.
2016 Global non-response rate (GNR) = 5.5 %
To learn how the projections are created visit the Population Projection Project Instructions tab.
See the Population Projections Project for Canada's Census Areas
The lines on the chart represent:
1) LL: Lowest Growth Lowest Fertility Scenario - lowest growth census period (from 1996 to 2001) and the census year with the lowest number of children under five relative to the number of females 15 to 44 years of age (2006) - the BLUE LINE.
2) LA: Low Growth, Average Fertility Scenario - CYAN (light blue) LINE.
3) AA, Average Growth Average Fertility Scenario - average growth census periods with average number of children under five relative to the number of females 15 to 44 years of age - GREEN LINE.
4) HA: Highest Growth Average Fertility Scenario - highest growth census period with average number of children under five relative to the number of females 15 to 44 years of age - the RED LINE
5) HH: Highest Growth Highest Fertility Scenario - highest growth census period and the census year with the highest number of children under five relative to the number of females 15 to 44 years of age - the PURPLE LINE.
Chilliwack's Age Distribution - some smooth, some unsteady, February 7, 2019
Chilliwack's population growth slowed between 2011 and 2016, February 12, 2019
Chilliwack's Child Women Ratios shift from teens to twenties, February 15, 2019
Chilliwack's Broad Age Groups and Dependency Ratios, 1996 to 2046, March 4, 2019