

Where will the baby boomers move next? As mentioned in many previous articles, areas outside on high commuter flows, with medium density, and also close to water, attract retirees from core areas. In the December 2014 article, The Perfect Demographic Storm we also looked at the attraction of 5 to 9 year olds and their parents to these areas as well.
With the small town of Hope located 2 hours from Vancouver, at the eastern end of the fraser valley, will more retirees and young families move in than out? Let's take a look at the current (since 1996) demographic trends and future possiblities.
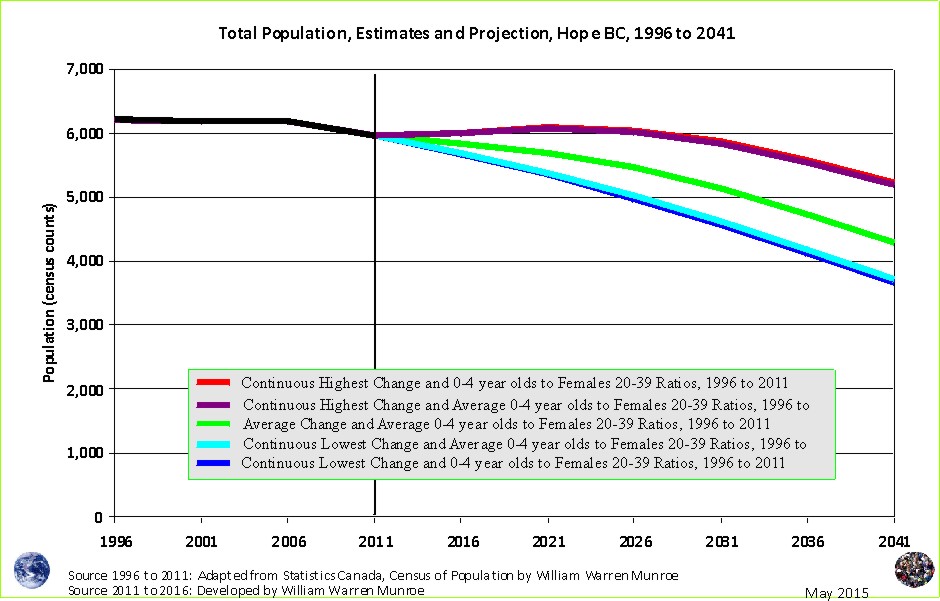
According to the census, Hope's total population declined by ~275 people between 1996 and 2011; therefore, more people moved out and died than moved in and were born.If current trends continue, the total population will be some where between 4 and 5 thousand by 2041.
Even though the population has declined, it is possible that the area is attractive to young families and retirees and that the area is not attractive to all the other age groups.
Now, let's take a look at the changes in the age distribution since 1996.
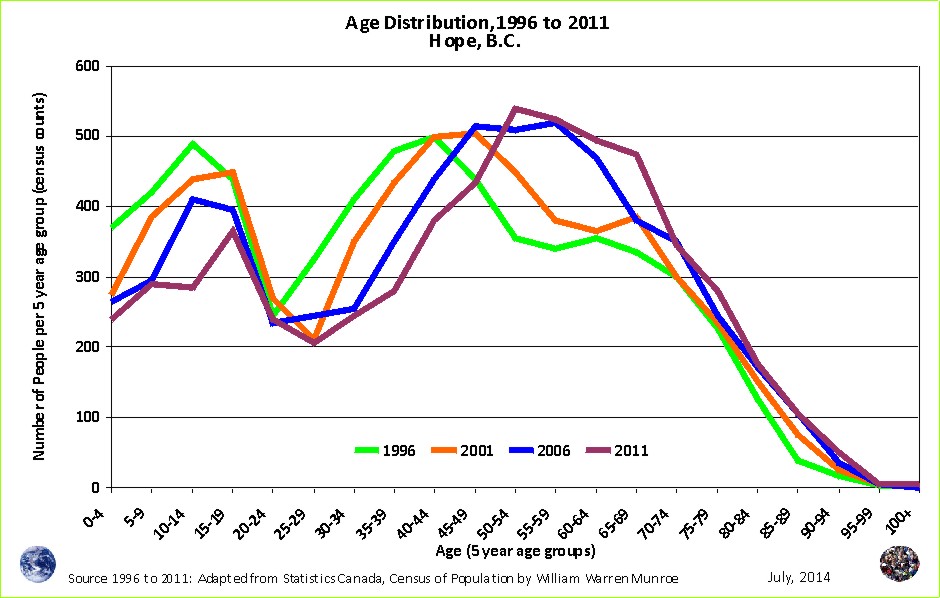
Not unlike many of the age distribution charts for small town BC, there are fewer young adults than the other 5 year age groups except for those 80 years of age and older.
The youngest age group, those 0 to 4 years of age, shows a decrease between 2006 and 2011 unlike the Canadian average.
The number of people of retirement age has grown but the increase between 2001 and 2006 is not reflected in the change between 2006 and 2011. The population signatures should provide some insight.
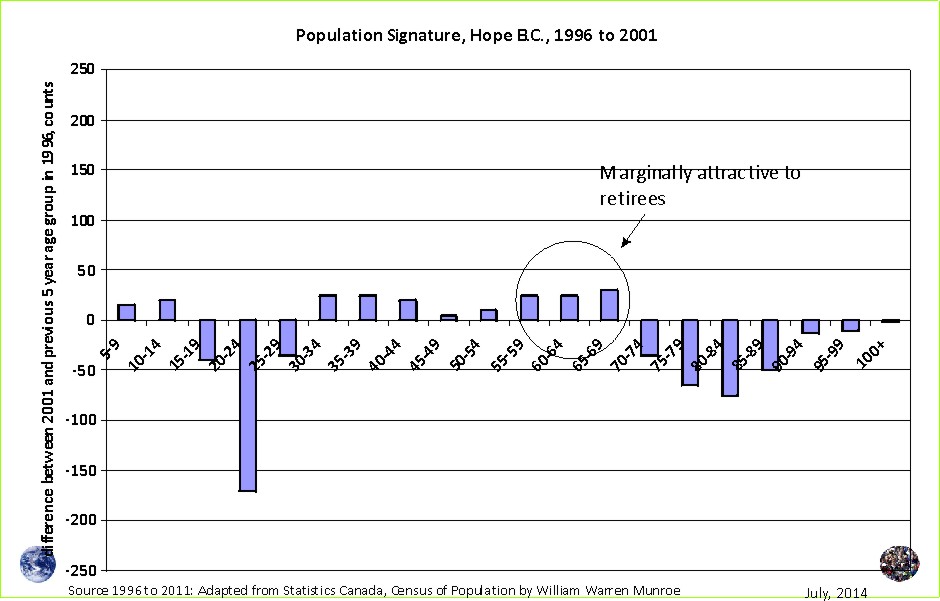

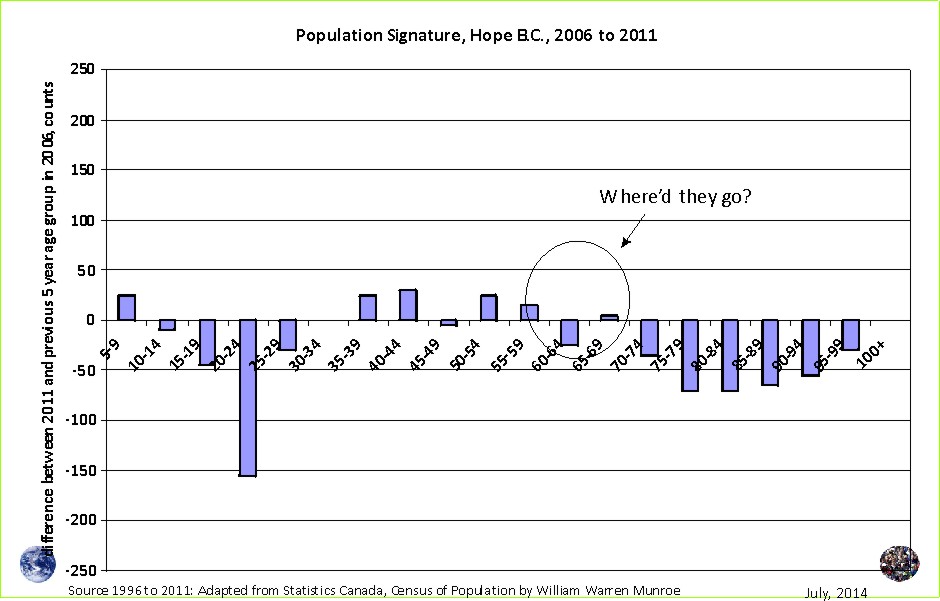
The population signature for Hope between 1996 and 2001 (Figure 3) shows more in-migration than out -migration for all the age groups except for people 15 to 29 years of age (the opposite to Ft. St. John) and the elderly.
While driving thru Hope, one can not help notice the large number of notices announcing vacancies at places designed for retirees.
What's going on?
Perhaps the number of elderly dropped because people found Hope to be too far away from the core (2 hours plus), or other factors were involved.
If the error in the count was low (~2to 4%) the decline experienced between 2006 and 2011 compared to the previous census periods, was substantial.
Some factors for moving out and not moving in include access to amenities and at least minor products and services, natural beauty (like Qualicum Beach), safety (low crime) and cleanliness, etc.
You sure do not want to be dealing with people under the influence demanding money while you are walking with your young children into facilities such as the bank or library.
Such is the nature of a truck stop, transient, high mobility junction such as Hope.

Unless the number of females of reproductive age increases, bucking current demographic trends, the number of children will continue to decline according to the medium scenario.
The decline in the number of females between 20 and 39 years of age slowed and this may lead to a turn around where we see this cohort increase in number; however, with below replacement fertility and so much out-migration of young adults, the only way the females of reproductive age can increase would be due to more in-migration than out-migration and death. What are the chances? My guess is that people from the core (GVRD) would look to Squamish or even Vancouver Island first.
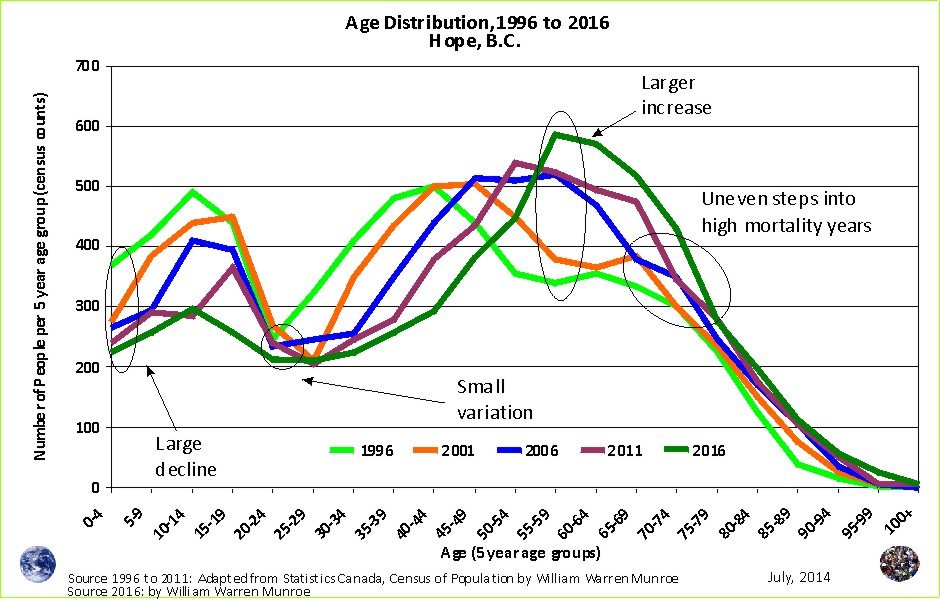
Let's take a look at the medium scenario projection of the age distribution for 2016.
If the average change experienced between 1996 and 2011 was to continue into 2016, we should see the number of young children continue to decline while the number of elders continues to grow unless of course the trend of fewer retirees, seen between 2006 and 2011, was to continue.
Of particular interest is the gutting of the number of people of working age. The results from the next census in 2016 should be interesting!
What do you see?
1 Statistics Canada provides age and sex counts for 1996, 2001, 2006, and 2011 for Canada's census (dissemination) areas; therefore, this projection scenario does not benefit from censuses prior to 1996, rather they use only "current" trends, providing approximations of fertility (0 to 4 relative to Females 20 to 39 year old), life expectance ('survival ratios' to use the UN term for 'cohort change ratios'), and net migration by five year age groups.
To download census counts go to: Statistics Canada's website at http://www12.statcan.ca/census-recensement/index-eng.cfm. Be sure to read the footnotes and check for important information such as boundary changes, and non-response.
To learn how the projections are created visit the Population Projection Project Education tab.
Population Projection Project for Canada's Census Areas
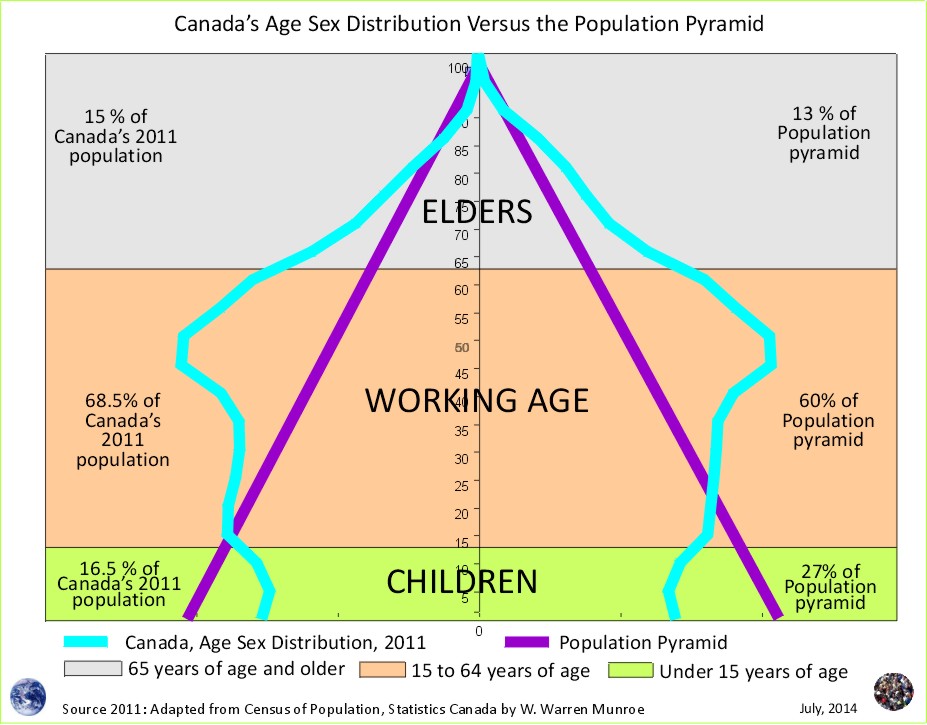
 Take a look at Canada's Age Sex Distribution animated projection (medium scenario). The animation starts at 1996 and clicks through to 2041. Notice in the 1996 chart, the baby boom bulge (which is just the resumption of more births than deaths - the population pyramid - after WW2) followed by fewer numbers in the younger age groups reflecting (resulting from) reduced fertility beginning in the mid 1960s. This medium scenario projection is an average of the 1996 to 2011 cohort change ratios thus creating a central tendency that eventually provides smooth lines in the younger age groups by the end of the projection period.
Why are Statistics Canada's projections so high compared to the United Nations and the Cohort Change Ratios projections? Read Why so different?
Government population projections for BC reflect an "up and to the right" aspiration, while the cohort change ratios method shows BC's population growth slowing, and levelling out. Read a "A Comparison of Population Projections for BC"...