


Qualicum Beach, on the east coast of Vancouver Island, is considered by many to be a town attractive to retirees. Less well known is that the area is also attractive to families. Even the former Member of the Legislative Assembly (MLA) who sold real estate in the area for over 30 years said families do not move to Qualicum; however, families do move here, just ask the many parents of children in elementary school.
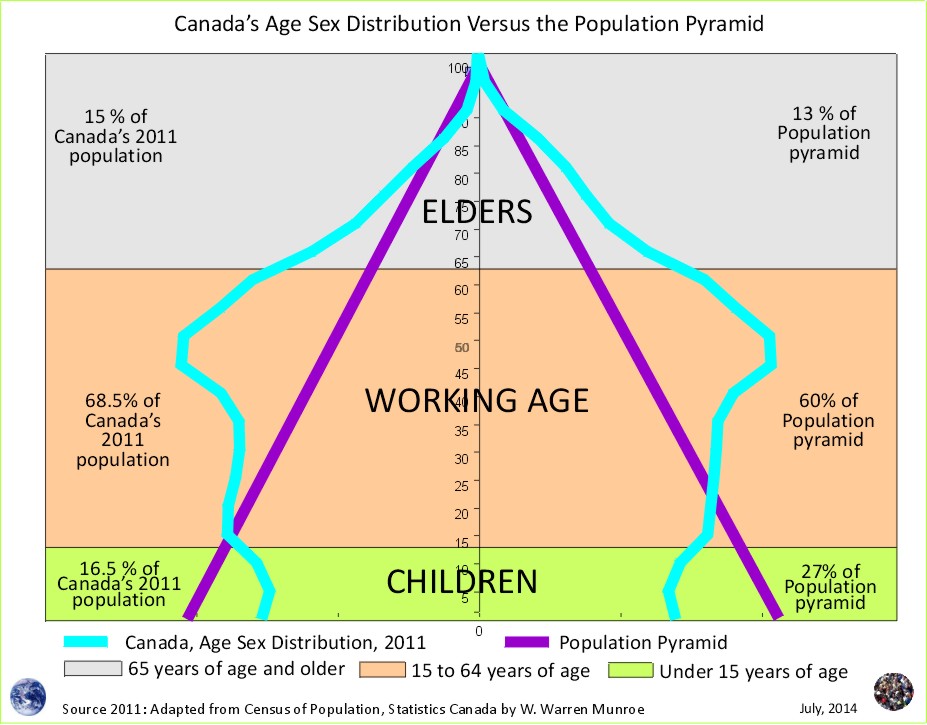
For Canada and small communities like Qualicum Beach the retiring baby boomers as well as the increase in elementary school children could result in the perfect demographic storm.
To figure out net migration by age, we can look at the 5 year age groups from the Census of Canada for the years 1996, 2001, 2006, and 2011, arguably the best data set in the world with which to examine and understand where we are and where we are heading on current demographic trends, both locally and nationally.
If no one moved and no one died then the number of 5 to 9 year olds would be the same as the number of 0 to 4 year olds counted five years earlier. The only way that the number of 5 to 9 year olds could be higher than the number of 0 to 4 year olds would be be because of a counting error or because more 5 to 9 year olds moved in than out and died during the five year between the census.
Let's take a look at the change in the number of people in the 5 to 9 year age group as well as the change in the number of people in the 65 to 69 year age group for Qualicum Beach compared to Canada as a whole since the end of the 20th century with a medium change scenario projection to 2016
For Qualicum Beach, in 2001, the number of 5 to 9 year olds was 6.5% more than the number of 0 to 4 year olds five years earlier; in 2006 the number of 5 to 9 year olds was 53% more than the number of 0 to 4 year old compared to 2001 (due in part to an expanded boundary), and in 2011 the number had increased by 6.9% compared to 2006. If instead of using the 53% increase in 2006, we use the 15% increase from the Parksville Census Agglomeration of which Qualicum Beach and the expanded boundary is within, the average change between these age groups between 1996 and 2011 was 9.5%.
What was the 5 to 9 year old percent change compared to the number of 0 to 4 year olds for Canada? 1996 to 2001 (3%); 2001 to 2006 (6.5%); and 2006 to 2011 (7%). Canada's average percent change between 1996 and 2011 was 5%. Over these years, Qualicum Beach had a higher % increase, almost double the Canadian average.
According to the census, since 1996, the Qualicum area is above the Canadian average for attracting young children (along with their parents). What will happen to communities that are attractive to retirees and young families?
The source of most in-migration to communities on Vancouver Island as well as to Squamish/Whistler and the Okanagan is the place with the highest population density in the province, the Greater Vancouver Regional District (GVRD).

Just as the large increase in the number of 0 to 4 year olds between 2006 and 2011 is resulting in the large increase in 5 to 9 year olds between 2011 and 2016, the population projection for Qualicum shows that the number of 65 to 69 year olds will likely increase by approximately 30% between 2011 and 2016, the same percent increase as was seen between the number of 60 to 64 year olds from 2006 to 2011; however, this projection is based on the 1996 to 2011 census counts for Qualicum. It does not take into consideration the jump in the number of people ageing into the 65 to 69 year age group in the rest of Canada, and in particular the GVRD.
Both the increase in the 5 to 9 and the 65 to 69 year olds occurring in the GVRD may result in a increase in in-migration to communities surrounding large population urban centers - places like Qualicum Beach unless of course ferry fees continue to climb thereby making communities on Vancouver Island less attractive to many mainlanders.
1 Statistics Canada provides age and sex counts for 1996, 2001, 2006, and 2011 for Canada's census (dissemination) areas; therefore, the projections do not benefit from censuses prior to 1996, rather they use only recent trends, providing approximations of fertility (0 to 4 relative to Females 20 to 39 year old), life expectance ('survival ratios' to use the UN term for 'cohort change ratios'), and net migration by five year age groups.
To download census counts go to: Statistics Canada's website at http://www12.statcan.ca/census-recensement/index-eng.cfm. Be sure to read the footnotes and check for important information such as boundry changes, and non-response.
Population Projection Project for Canada's Census Areas
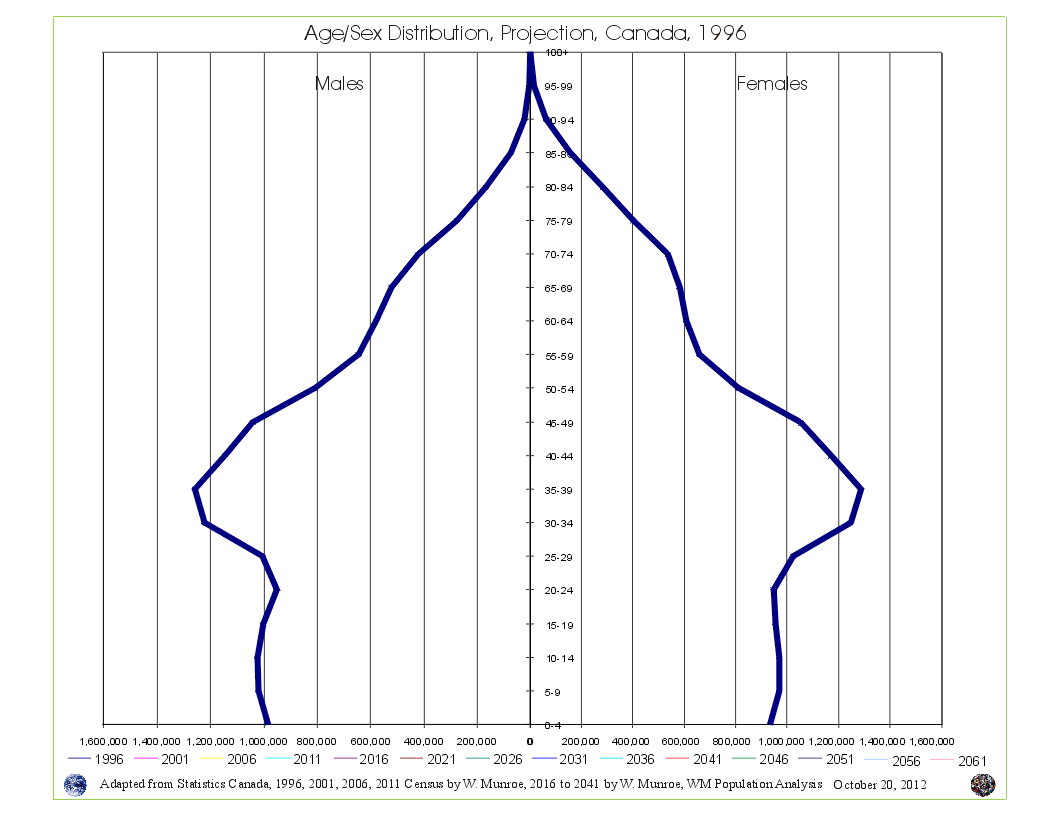 Take a look at Canada's Age Sex Distribution animated projection (medium scenario). The animation starts at 1996 and clicks through to 2041. Notice in the 1996 chart, the baby boom bulge (which is just the resumption of more births than deaths - the population pyramid - after WW2) followed by fewer numbers in the younger age groups reflecting (resulting from) reduced fertility beginning in the mid 1960s. This medium scenario projection is an average of the 1996 to 2011 cohort change ratios thus creating a central tendency that eventually provides smooth lines in the younger age groups by the end of the projection period.
Why are Statistics Canada's projections so high compared to the United Nations and the Cohort Change Ratios projections?
Government population projections for BC reflect an "up and to the right" aspiration, while the cohort change ratios method shows BC's population growth slowing, and levelling out. Read a "A Comparison of Population Projections for BC"...