


In 2012 British Columbia's Premier Clark expressed some of the frustration many people in Canada's most western province have experienced, namely the "sick culture" within the provincial capital, Victoria British Columbia. A cure for an "unhealthy" culture may not be easy to find; however, Premier Clark suggested communities - places where people live and work and express their concerns, may help provide a cure.1
But how can people at the community level participate when we must use numbers created in Victoria to make local level decisions, and when we point out discrepancies, deficiencies, provide alternative information, and suggest improvements, public service senior staff can use tax payer's dollars to hire lawyers to threaten tax payers (as well as public service employees who may also point out deficiencies) with paying damages to the public service senior staff for defamation?
This is what happened to Elvena Slump and many others across BC including myself. Indeed, the mayor, who authorized the use of taxpayer dollars to hire a law firm to send the threatening letter to Slump, said that 90% of the people who receive these letters apologize, and their behaviour changes.3 At the same time, there is another example of an unhealthy culture spreading out from within the provincial capital.
Local level decision-making often refers to "findings" from BCs Official Statistical Agency, BC Statistics; however, unlike Statistics Canada, BC Statistics does not have formal policies and clear accountabilities designed to safeguard against the "intrinsic risks" and "dangers of monopoly" inherent in Official Statistical Agencies - risks such as "publishing material that is mostly designed to justify the programs and approaches of the government."4
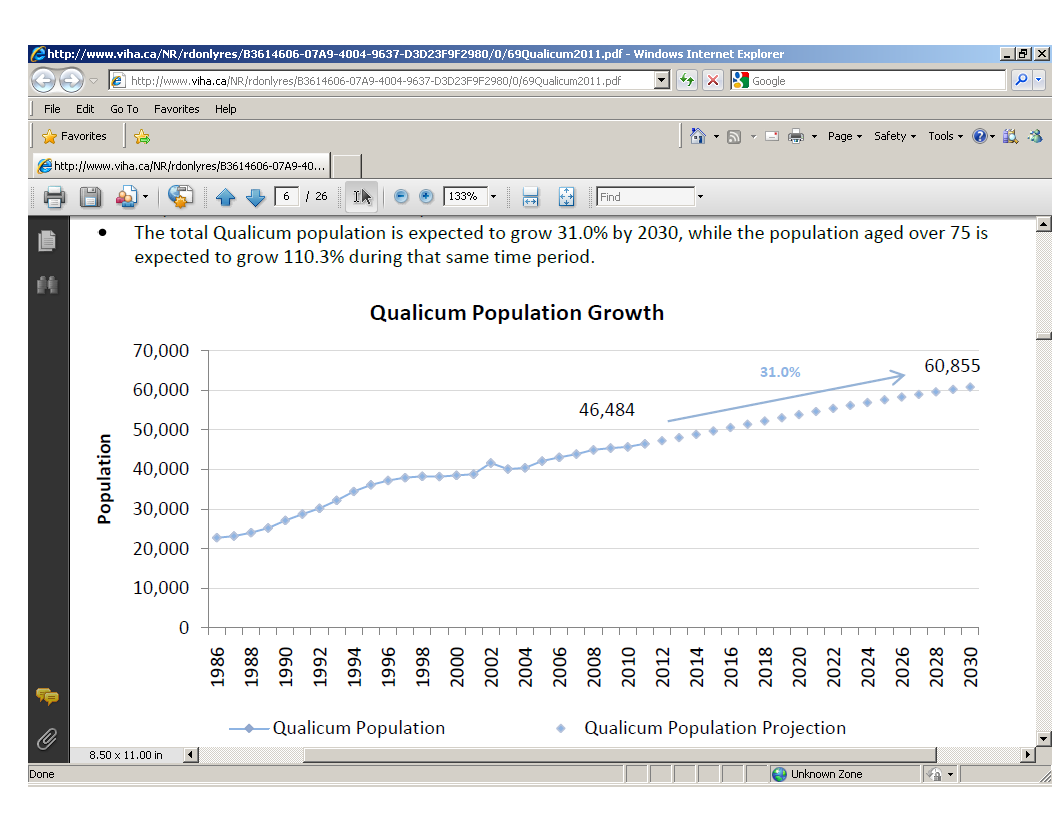
For example, two departments of government, namely health and education, each provided a very different population forecast in 2013 for the same local area. The Medical Health Officer presented at a Qualicum Beach Town Council meeting this chart created by BC Statistics personnel of a single possible future population, increasing by over 30%. Also in 2013, at public consultation meetings addressing recommendations to close schools, the Superintendent of Schools showed a much lower forecast. In both cases, only one possible future forecast was offered. The Medical Health Officer showed only one future possibility while the Superintendent of Schools also showed one (very different) future possibility. 6
Statistics Canada clearly states, rather than providing only one forecast of a possible future, that a set of well defined possible projection scenarios (more than one) must always be published:
"How can society intelligently participate in the setting of national [or local- wm] priorities if the population does not understand where we are, and where we are heading on current trends."
"Forecasting pretends to foretell the future, while the projection is an analytic tool which -- within the constraints of a tightly specified model -- enables the analyst to consider the implications of alternative scenarios."
"The issue of scenarios is important: in order to underline the analytic character of projections, it is our policy to publish always a set of possible projections, each corresponding to a well defined an [sic] analytic scenario." (Former Chief Statistician, Statistics Canada, Ivan Fellegi, 1999)7
Yet, citizens can be blocked from presenting well defined possible projection scenarios at Town council meetings. Indeed, I have been allowed to present at many national and international population conferences, a set of well defined population projection scenarios for Canadas census areas, including scenarios for the Town of Qualicum Beach and surrounding areas; however, while, allowing the Ministry of Healths presentation of a single forecast at a Town of Qualicum Beach Town Council meeting in 2013, the senior staff and many elected representatives for the Town of Qualicum Beach, since 2012, blocked my presentation of well defined population projection scenarios . Eventually I was informed:
Thankfully, the Mayor, Teunis Westbroek, did advocate a presentation of a set of well defined projection scenarios. The Premier may be correct, a cure may yet come from the local level.
Perhaps, a cure begins with removing the "dangers of monopoly"; for example, citizens should not be blocked from, (nor threatened i.e. Elvena Slump and others) for, presenting information. Also, methods used to create statistical products and non statistical products such as forecasts, must be open to external review. Also, quotes (including quotes used to assert the "integrity" of government agencies) must be accompanied with the reference to the source of the quote.
For example, a Statistics Canada's assessment of BC Statistics methods was withheld claiming:
Unfortunately, a small group of BC Statistics personnel who are not responsible to anyone, may choose to publish incorrect methods and data to accompany forecasts, while jealously and aggressively protecting their monopoly - pretending to foretell the future.10
Fortunately, the Population Projections Project for Canadas census areas, available on the Internet, provides well defined population projection scenarios for Canada's municipalities, regions / counties, and other census areas - a reference with which to help understand where we are and where we are headed on current demographic trends.11
Premier Christy Clark may be correct, health may yet be restored, thanks to people like Elvena Slump who clearly states:
Thanks also to projects like the Population Projection Project, designed to provide understandable, verifiable, reproducible, valid (can be validated) population projections using an easy to understand and use a well documented widely accepted method (cohort change ratios) referring to current demographic trends found in Canada's open, public, readily available Census of Population conducted every five years, arguably the best dataset in the world with which to understand current local to national demographic trends.
1 Comments made in September 2012: National Post and most main stream media. CORRECTION added May 8, 2017: the comments were made by Christy Clark in May 2012, at the end of an interview with Brian Hutchinson in Vancouver but not reported until September 18, 2012 "BC Premier avoids 'sick culture'in legislature" in the National Post. Several other media outlets also ran stories about the 'sick culture' including the CBC, CTV, Times Colonist, Financial Post, Globe and Mail to name a few.
2See the Global TV news cast at: http://globalnews.ca/news/1542410/penticton-senior-accused-of-defaming-city-staff/
3 Interview with Penticton Herald and Penticton Mayor Litke at http://www.pentictonherald.ca/news/article_a419af38-34a4-11e4-b19b-0017a43b2370.html
4 From "The United Nations Economic and Social Council, Statistical Commission and Economic Commission for Europe, Conference of European Statisticians, 47th plenary session, "Analytic Activities at Statistics Canada", submitted by Statistics Canada, prepared by Chief Statistician, Ivan Fellegi, 1999." www.wminfomatics.com/WP/ANALYTIC_ACTIVITIES_AT_STATISTICSCANADA.pdf
5 Figure 1: This forecast was created in 2011, prior to the release of the 2011 census results; therefore, the most recent census reference year was 2006. Read about the use of the change in the number of telephone lines used by BC Statistics senior staff as an indicator of population change from 2002 to 2009 at www.wminfomatics.com/WP/index2.html.
6 The chart, presented in March 2013, was created by the people working at BC Statistics in 2011; therefore, it does not include the 2011 census results as these were released in 2012. http://www.viha.ca/NR/rdonlyres/B3614606-07A9-4004-9637-D3D23F9F2980/0/69Qualicum2011.pdf
For the forecast used at the School Closure meetings see the Qualicum School District "Facility Review Process" November 2013 at www.sd69.bc.ca/Publications/Facility%20Review%202013%20-%20Finance%20and%20Facility%20Planning/13.11.26%20Facilities%20Review%20Presentation.pdf
Read all about the forecast presented by the health representative and the very different forecast presented by the Superintendent of Schools at www.wminfomatics.com/WManalytics/Articles/140318/QSDFR_PPP_5.html.
7 Fellegi, 1999
8 Qualicum Beach Corporate on behalf of council members and the town planner, 2012 / 2013.
9 Cindy Elbahir, Manager, Central Agency Team, Information Access Operations, June 22, 2012. The request for a copy of Statistics Canadas assessment of BC Statistics methods was denied claiming "disclosure harmful to intergovernmental relations and negotiations". Statistics Canada did send the assessment of methods for equalization payments revealing BC Statistics falsified reports. Posted at www.wminfomatics.com/WP/Articles/120622/FOI_STC_Finance.pdf.
10 The author, having served as a Population Analyst for BC Statistics, was threatened by a contract lawyer from Heenan Blaikie (now collapsed), with paying damages to government employees (co-workers) for stress they may endure if the author pursued mediation and arbitration in an effort to resolve accusations made by BC Statistics senior staff of causing government employees to feel unsafe.
During this time period, BC Statistics senior staff were falsifying reports sent to Statistics Canada contained in "The Equalization Program and the Property Tax Base: Feasibility Study Conducted by Statistics Canada", www.wminfomatics.com/WP/home.html. Read the correspondence from August 2011 to present particularly the October 19, 2012 letter to the Minister responsible and Statistics Canada.
Also, see the abridged introduction portion of my presentation to the 2013 Congress, Canadian Population Society Methods for Projections session, "Population Projections for Community Members: Why Verify Population Numbers", W.W. Munroe, June 2013, www.wminfomatics.com/PopulationProjections/CPS_PPP_Validate.pdf
11 The Population Projections Project was developed to provide community members with a clearly explained, understandable, verifiable, valid (can be validated) set of population projection scenarios developed from open public current demographic data, namely the Census of Population from Statistics Canada, www.wminfomatics.com/PopulationProjections/CND2a.html. To read what people are saying about the project see www.wminfomatics.com/PopulationProjections/feedback.html
12 Elvena Slump quoted in an article by JAMES MILLER, Penticton Herald, Posted: Wednesday, September 17, 2014 7:26 pm | Updated: 8:26 am, Thu Sep 18, 2014
Population Projection Project for Canada's Census Areas
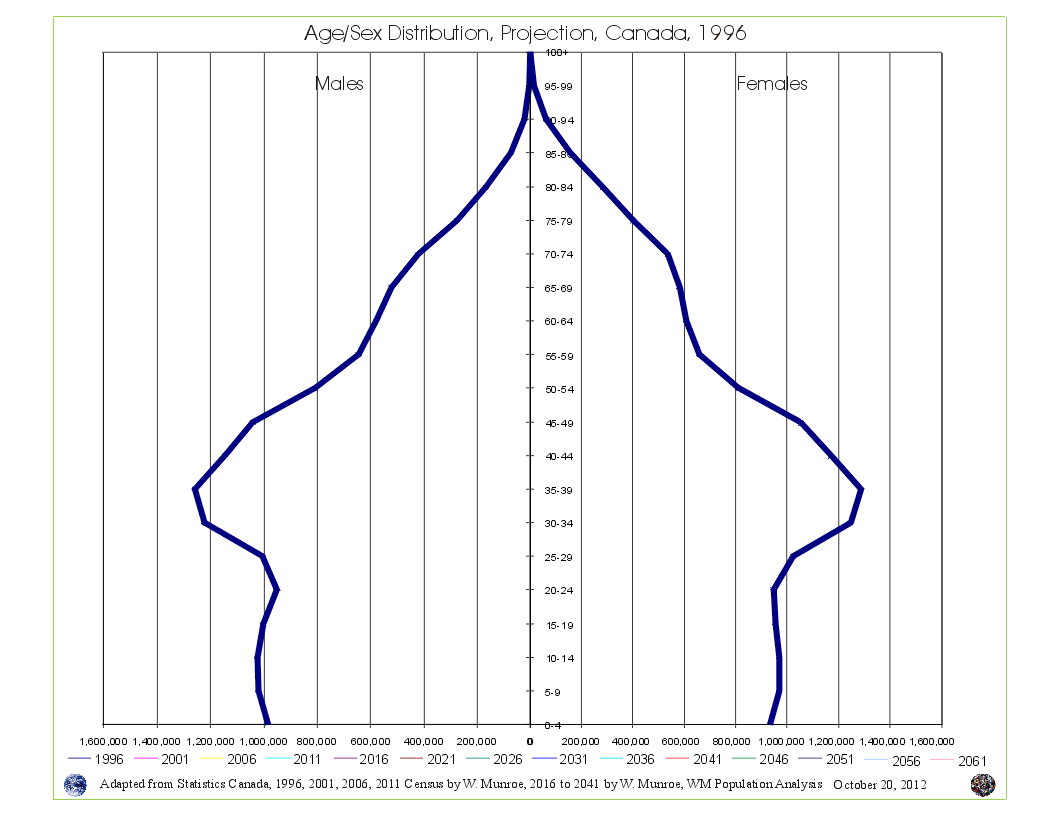 Take a look at Canada's Age Sex Distribution animated projection (medium scenario). The animation starts at 1996 and clicks through to 2041. Notice in the 1996 chart, the baby boom bulge (which is just the resumption of more births than deaths - the population pyramid - after WW2) followed by fewer numbers in the younger age groups reflecting (resulting from) reduced fertility beginning in the mid 1960s. This medium scenario projection is an average of the 1996 to 2011 cohort change ratios thus creating a central tendency that eventually provides smooth lines in the younger age groups by the end of the projection period.
Why are Statistics Canada's projections so high compared to the United Nations and the Cohort Change Ratios projections?
Government population projections for BC reflect an "up and to the right" aspiration, while the cohort change ratios method shows BC's population growth slowing, and levelling out. Read a "A Comparison of Population Projections for BC"...