Happy Day After Your Birthday Canada! Now that we have looked at the projection (medium scenario) for young children and seen the numbers fluctuate between 1.7 and 2 million, as well as females 25 to 34 years of age, let's take a look at the impact of the rise of the elderly.
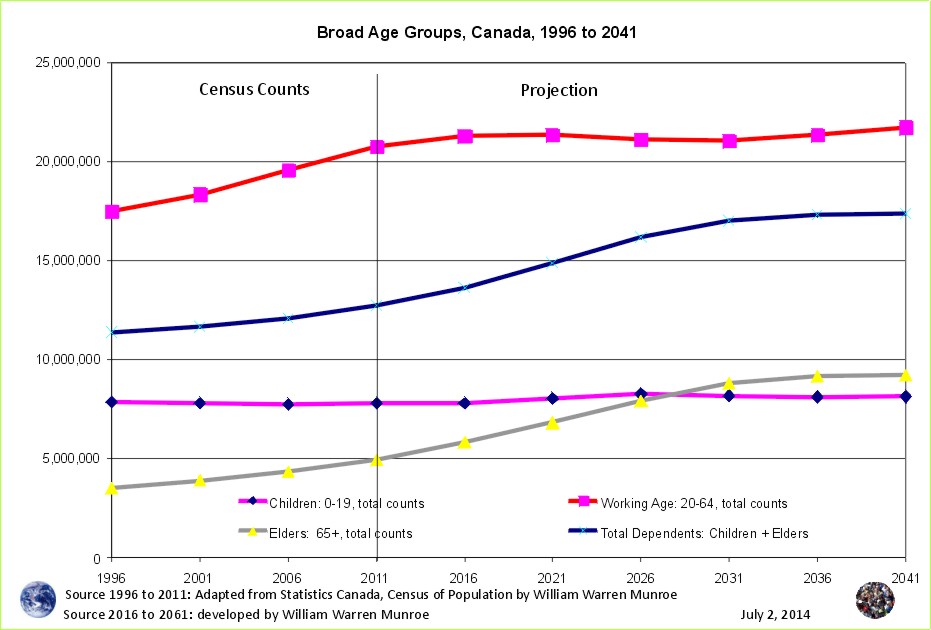
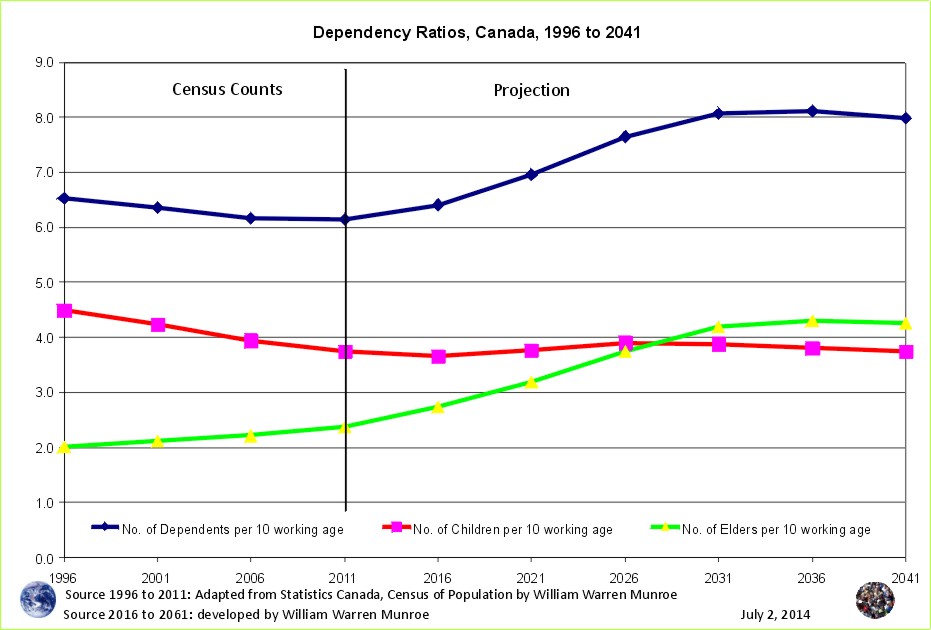
While the number of those of working age (20 to 64 years of age here) and the elderly (65 plus) continues to rise, the number of children has, and is projected to stay much the same. Consequently, the ratio of dependents to workers is projected to level out at about 8 dependents per 10 working age, up from 6.5 in 1996. Enjoy the relatively low dependency ratio while it lasts.
Will the future prove to be more difficult for Canadians as the baby boomers age out of the work force? What if the working age, now 67 in some places, rose to include 69 year olds? What about the rapidly increasing productivity, including the benefits from the technologies that are bringing us into the information age - will the increased productivity make things easier on those of working age?
What do you think?
1 The figures for 1996, 2001, 2006, and 2011 are adapted from Statistics Canada, 1996, 2001, 2006, and 2011 Census of Population counts, by William Warren Munroe. The projections (2016 plus) are developed referring to the 1996, 2001, 2006, and 2011 census counts using the cohort change ratios method.
Statistics Canada. 2012. Population and dwelling counts, for Canada, provinces and territories, 2011 and 2006 censuses (table). Population and Dwelling Count Highlight Tables. 2011 Census. Statistics Canada Catalogue no. 98-310-XWE2011002. Released February 8, 2012. http://www12.statcan.ca/census-recensement/2011/dp-pd/hlt-fst/pd-pl/File.cfm?T=101&SR=1&RPP=25&PR=0&CMA=0&S=50&O=A&LANG=Eng&OFT=CSV (accessed February 08, 2012). For further information, refer to: http://www12.statcan.gc.ca/census-recensement/2011/dp-pd/hlt-fst/pd-pl/Notes-eng.cfm.
Population Projection Project for Canada's Census Areas
 Take a look at Canada's Age Sex Distribution animated projection (medium scenario). The animation starts at 1996 and clicks through to 2041. Notice in the 1996 chart, the baby boom bulge (which is just the resumption of more births than deaths - the population pyramid) followed by fewer numbers in the younger age groups reflecting (resulting from) reduced fertility. This medium scenario is an average of the 1996 to 2011 cohort change ratios thus creating a central tendency that eventually provides smooth lines in the younger age groups by the end of the projection period.
Why are Statistics Canada's projections so high compared to the United Nations and the Cohort Change Ratios projections?
Government population projections for BC reflect an "up and to the right" aspiration, while the cohort change ratios method shows BC's population growth slowing, and levelling out. Read a "A Comparison of Population Projections for BC"...