The most recent articles have explored Canada's two west (wet) coast communities Ucluelet and Tofino to see if the transition from resource extraction, with some primary refinement, to tourism / accommodation / recreation may be reflected in population change.1 Now let's take a look at the change in the counts categorized into broad age groups - under 20, 20 to 64 inclusive, and those 65 plus, along with projections of the average change seen between 1996 and 2011:


Looking first at the 1996 to 2011 census counts for these broad age groups for these communities, we see two substantial changes: 1) In Ucluelet the number of those under 20 has declined by ~40%, 2) while in Tofino, the number of those of working age has doubled.
These two changes impact the projections highlighting a fundamental feature of the cohort change ratios method:
For Ucluelet, the decline in the number of children seen between 1996 and 2011 is projected into the future resulting in the steady decline for children to 2041. Since the CCR projections for those of working age are built on the declining projection for children, the number of those of working age also declines even though young adults began to increase between 2001 and 2006. It would be worthwhile create a projection scenario dropping the 1996 to 2001 census period and using just 2001 to 2011 or just 2006 to 2011 to reflect the increase in the influence of the tourist economy on the coast.
For Tofino, the projection for those under 20 rises, though relatively slowly for 2 reasons:
1) between 1996 and 2011, the number of children under 20 stayed much the same, (the average CCRs for those 0 to 4 and 5 to 9 year of age were marginally negative while slightly positive for those 15 to 19).
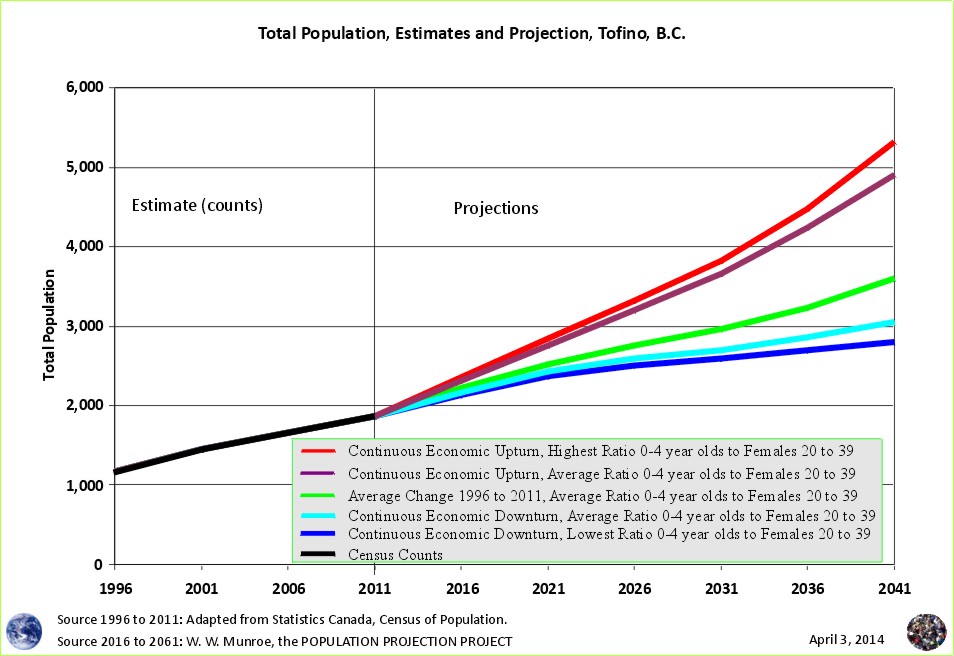
2) the number of those young children (under 5 years of age) rises because the number of females 20 to 39 years of age is projected to continue to rise rapidly. The projection assumes that the relationship between children and females 20 to 39 will continue to be an average of the ratio seen between 1996 and 2011 - approximately 1 young child to 3 females. For 2016 the projection for females 20 to 39 is 500, up from 435 in 2011. This results in 50 more 0 to 4 YOs (30% of 500) up from 105 in 2011, to 155 in 2016.
The ratio of reproductive females to young children in Tofino declined from 40% in 1996 to 25% in 2011; therefore, if the ratio stays low (1 young child to 4 females 20 to 39), we should consider the light blue line of the projections to be more likely.
The number (155) of young children, 0 to 4, age from 2016 into the 5 to 9 age cohort in 2021 with a marginal dip in numbers reflecting the average CCR between 1996 and 2011, and again aging into the 10 to 14 cohort in 2026, and again into the 15 to 19 cohort in 2031. The larger number of 15 to 19 year olds sets the stage for large increases for the 20 to 24 years olds after 2031.
As we have seen, Tofino is attractive to 20 to 24 YOs. The average cohort change ratio (from 1996 and 2011) between those 15 to 19 and those 20 to 24 was found to be 100% . Using the CCR to calculate the number of those 20 to 24 years of age into the future, we double the number of those 15 to 19 years of age. Therefore, after 2031, the number of those 20 to 24 is calculated to rise more rapidly (based on the 30% child to female cohort ratio) along with the total population for Tofino. Again, the light blue average growth with low fertility appears to be more likely.
The charts show again that the population - age distribution - did change substantially since the heady days (daze?) of environment protection protests in the early / mid nineteen nineties. Perhaps not surprisingly, the population has increased in tourish Tofino, while declining in fisher / lumber jack (Jacqueline?) Ucluelet.
Now that we have looked at the broad age groups, let's take a look at the change in dependency ratios in the next article.
1 Our examinations (related reading) keep in mind the strengths and weaknesses of the data (Statistics Canada's Census of Population - arguably the world's best data source with which to examine current demographic trends - undercount estimated at 2% but this varies by area and by age group - for example young adults, and males in particular are often on the move in May when the census is conducted) and the projections method (the cohort change ratios methods used by the United Nations). We are particularly watchful of becoming overconfident when looking at small population areas - under 10,000 people.
2 Adapted from Statistics Canada, 1996, 2001, 2006, and 2011 Census of Population, by William Warren Munroe
1996 Census: Catalogue Number 95F0181XDB96001.
2001 Census: Catalogue Number 97-551-XCB2006009. (this is the source provided with the download for Alberta for 2001 Age Sex census counts which is the same as the 2006 Catalogue Number)
2006 Census: Catalogue Number 97-551-XCB2006009.
2011 Census: Catalogue Number 98-311-XCB2011024.
1996 is the starting point because this was when readily available data became available on the internet in a form comparable to later years, providing an understanding of recent trends.
For more information on how to create population projections see the Population Projection Project.
Outdoor Recreation to Family Formation in Tofino and Ucluelet
From Resource Extraction to Tourism and Accommodation - Ucluelet's Changing Demographics
Population Projections for the Parksville Census Agglomeration
Why are Statistics Canada's projections so high compared to the United Nations and the Cohort Change Ratios projections? Why so different?
Government population projections for BC reflect an "up and to the right" aspiration, while the cohort change ratios method shows BC's population growth slowing, and levelling out. Read a "A Comparison of Population Projections for BC"...