
Over the last two decades, the transition from resource extraction to tourism and accommodation has impacted the population age distribution in Tofino with more and more young adults moving in while more families move out than in.1
Since the environmental activism during the early / mid nineteen nineties, more children and parents/guardians - under nineteen and those 30 to 50 years of age - have been moving out than in, while more 20 to 34 year olds have been moving in than out.
The total population has increased from approximately 1,200 to 1,900 from 1996 to 2011. What will the future look like if current trends continue? First then, what do the current trends look like? The best way to see current trends for those over 5 years of age is to look at the population signature
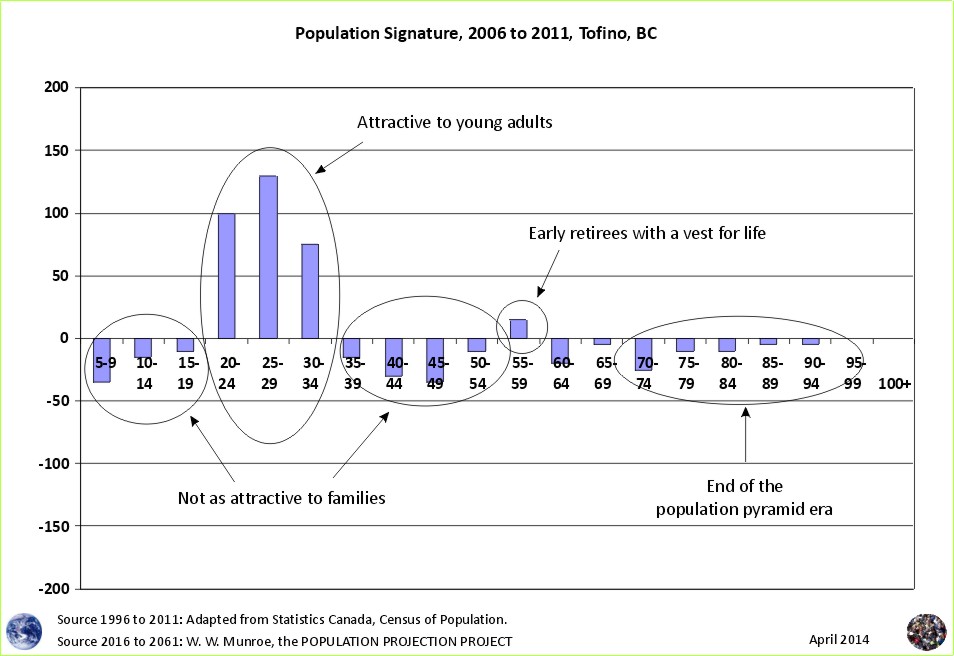
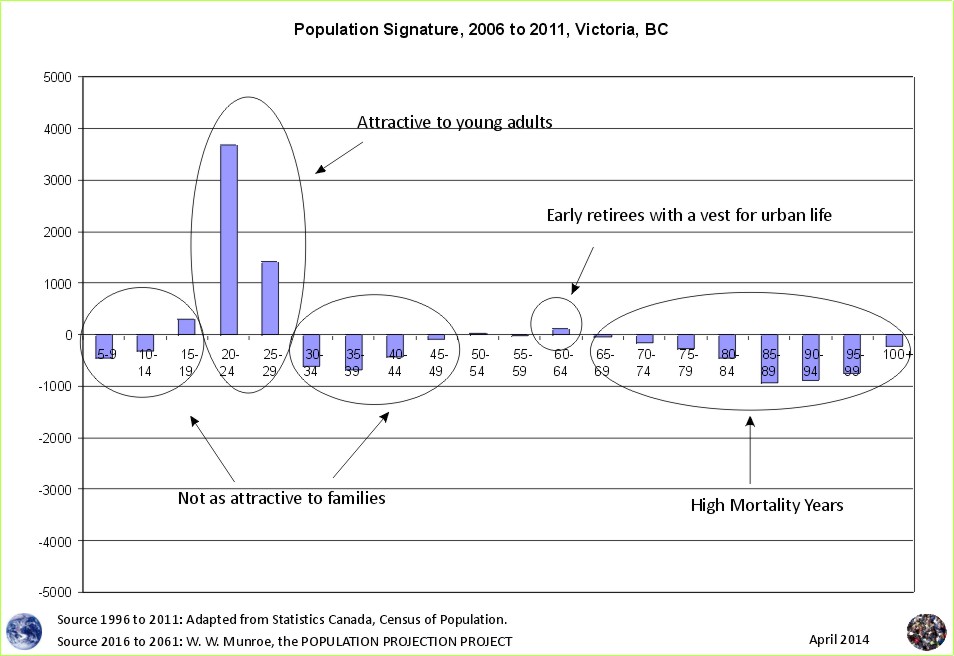
Tofino shares a similar population signature with university towns such as Victoria BC which is also an administrative center. In Figures 2 and 3 we see the patterns are similar, both areas being attractive to young adults but not so much for families. After their twenties and into their thirties, many more move out than in, some back to their home towns, some with a partner and child.
To see future population scenarios, we can use these population signature patterns to project what the total population, the age sex distribution, and the dependency ratios will look like if current trends continue.
For example, what if the migration pattern seen in the population signatures - more young adults moving in than out, and more people of family age moving out than in - continues? What if migration for people of retirement age and life expectancy continues to be the same? But what about the children under 5 years of age?
Since population signatures compare one census to the next we must find a way to project the change in the number of children under 5 years of age. We do this by watching the change in the number of females of reproductive age.
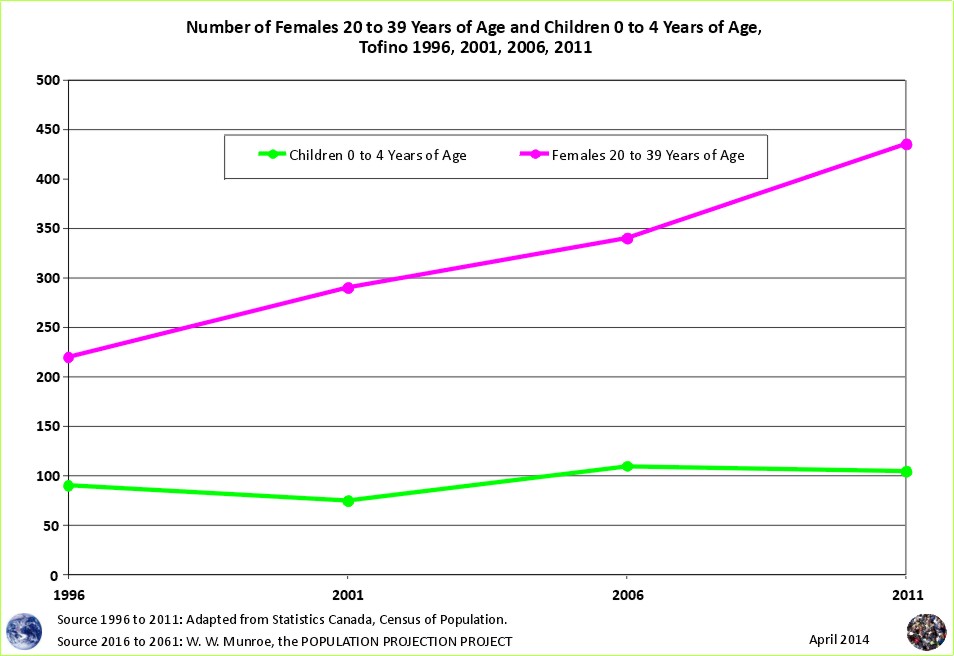
When considering future population change, the single most important group (cohort) to watch is the females of reproductive age, because they can increase the population like no one else can.
Usually, as the number of 20 to 39 year old females rises, so does the number of children under five. Indeed, for most places in Canada, this relationship is very strong, where we can be very confident (over 95% confident) that if we know the number of 20 to 39 year females, we figure out (y=ax-b) the number of children under 5.
Not every area is the same though. In some areas the number of females 25 to 39 provides greater confidence in knowing what the under 5 numbers will be, while in other areas the number of 20 to 34 year old females provide more confidence. Tofino differs in that as the number of females in these cohorts changed between 1996 and 2011, the number of children under 5 did not change correspondingly. The strongest relationship for under 5 year olds was with females 30 to 34 year age for Tofino for this time period (R2 of 75%).
Using the pattern seen in the population signatures, as well as current trends in the relationship between females of reproductive age to the number of those under 5, we can create well defined population projection scenarios.
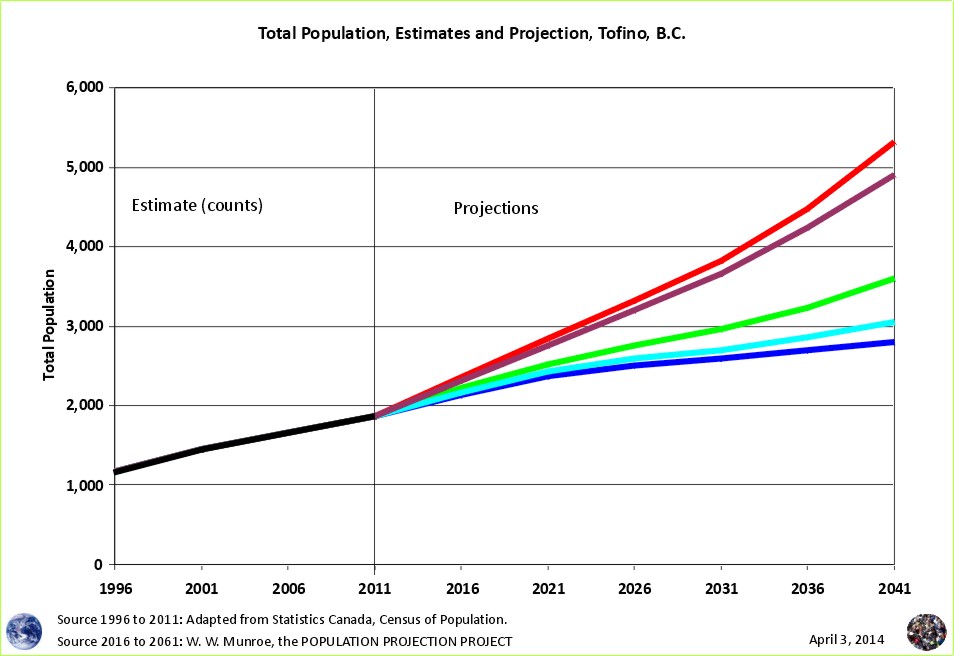
Figure 5 shows the total population projections using cohort change ratios based on current trends for Tofino. Since Tofino is small in population size, we have less confidence in the long term projections. Indeed, I would suggest limiting this projection to 2031 or 2036. If current trends continue, and barring any shocks that may impact the population totals (i.e. changes in access to energy as well as between war and peace), the total population over the next 15 to 20 years should fall within the range provided in Figure 5, approximately 2,600 to 4,000, with a medium scenario (average of cohort changes between 1996 and 2011) of ~3,000 around the year 2031.
Another consideration is the declining population in the neighbouring town of Ucluelet in recent years. Perhaps the two population centers, Tofino and Ucluelet, will share future in-migration more evenly?
For population projections using well defined scenarios refer to the Population Projection Project.
1 The figures for 1996, 2001, 2006, and 2011 are adapted from Statistics Canada, 1996, 2001, 2006, and 2011 Census of Population counts, by William Warren Munroe. The projections (2016 plus) are developed referring to the 1996, 2001, 2006, and 2011 census counts using the cohort change ratios method.
Statistics Canada. 2012. Population and dwelling counts, for Canada, provinces and territories, 2011 and 2006 censuses (table). Population and Dwelling Count Highlight Tables. 2011 Census. Statistics Canada Catalogue no. 98-310-XWE2011002. Released February 8, 2012. http://www12.statcan.ca/census-recensement/2011/dp-pd/hlt-fst/pd-pl/File.cfm?T=101&SR=1&RPP=25&PR=0&CMA=0&S=50&O=A&LANG=Eng&OFT=CSV (accessed February 08, 2012). For further information, refer to: http://www12.statcan.gc.ca/census-recensement/2011/dp-pd/hlt-fst/pd-pl/Notes-eng.cfm.
Why are Statistics Canada's projections so high compared to the United Nations and the Cohort Change Ratios projections?
Government population projections for BC reflect an "up and to the right" aspiration, while the cohort change ratios method shows BC's population growth slowing, and levelling out. Read a "A Comparison of Population Projections for BC"...