In yesterday's article we saw how the Baragar enrolment forecast presented at the end of November 2013 is lower and stays much lower to 2027 than the enrolment forecast presented at the beginning of October 2010.
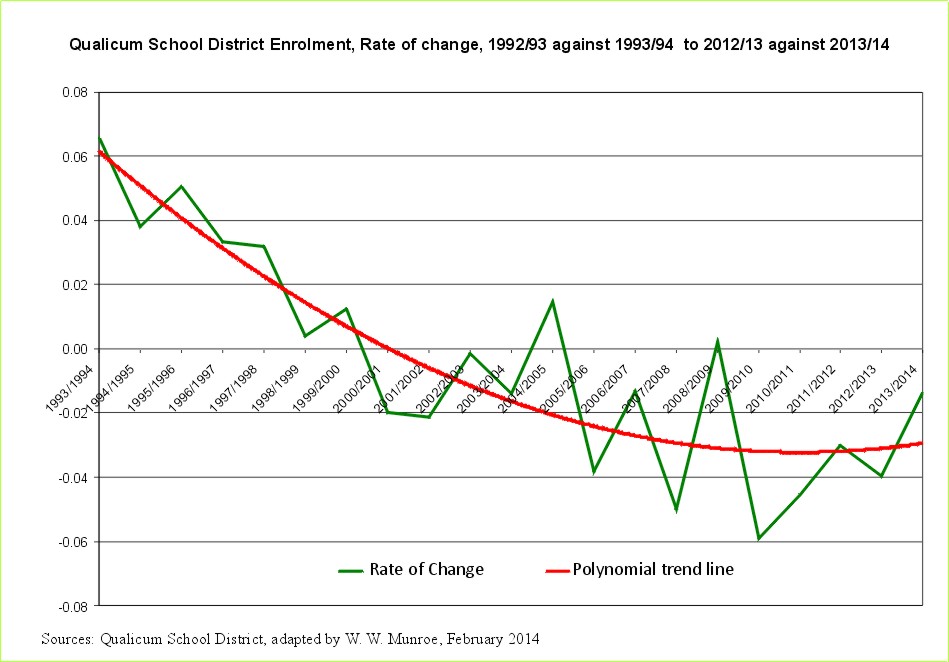
But which forecast is more reasonable? Has the decline in enrolment bottomed out and about to rise again in 2016/17 as forecast in 2010 or will the enrolment decline more than expected as Baragar foretells? One way to check is to look at the rate of change in enrolment1.

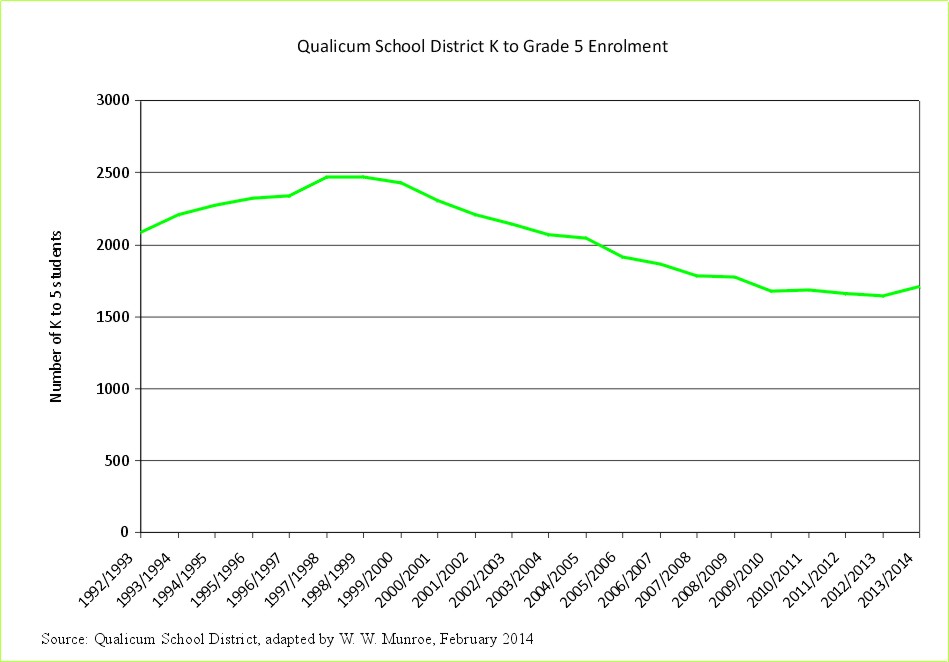
We know that enrolment declined from 1983/84 to 1985/86 then rose until 1999/2000, then declined again and is expected to rise again2.
Consequently, the rate of change in enrolment was highest as the enrolment increased in the 1990s, slowing to 1999/2000 then becoming negative. The rate of change in enrolment became increasingly negative until 2008/09 2009/10 when the rate of change was most negative. Since then however, the rate of change has continually been less negative indicating that the enrolment is near the lowest level and will likely begin to increase again as was forecast in 2010.
With the echo aging out of high school, starting over ten years ago, the number of females of reproductive age ( 20 to 39 year olds) is increasing again resulting in more births and the increase in enrolment in the elementary schools.

As mentioned in yesterday's article and worthwhile repeating:
What do you think?
For verifiable, reproducible, projections by five year age groups using an easy to understand, open, verifiable, valid method (census survival ratios - a United Nations term) referring to open public data (Statistics Canada's Census of Population) visit the Population Projection Project. This project is designed to show elected representatives and concerned citizens how projections are created, and has already been shown in some QSD high school classes.
The people living in the Qualicum School District deserve to be able to use verifiable projections (rather than unverifiable numbers created by a small group of people who are not willing to provide the methods and input data) including scenarios created using the methods and data used in the Population Projection Project (PPP).
See the chart provided in 2010 and the charts developed from additional information showing the "Population Change and the Fluctuating Enrolment"
See the "Enrolment forecast changed without explanation "
See the letter to the Qualicum School District Board of Trustees, February 25, 2014 (follow up sent February 26, 2014 - received 2012/13 and 2013/14 enrolment counts - thank you Mr. Koop)
See the letter to the Qualicum School District Board of Trustees, February 27, 2014
1the rate of change is calculated by looking at the change in enrolment from one school year to the next. If the enrolment increased from 100 to 110 the next year the rate of change would be 10%. When enrolment declines, the rate of change goes negative. Little change in the enrolment equals little rate of change.
2Why does enrolment fluctuate? Because the number of people (particularly females) of reproductive age fluctuates (those 20 to 39 years of age) - Boom, Bust, Echo and on. The echo began aging out of grade school ten years ago leaving lower enrolment in the middle and high schools; however, this echo is aging into reproductive years resulting in births beginning to increase again. Subsequently enrolment in elementary schools is starting to turn around.
Also, the Qualicum School District is attractive to families, not just retirees. Indeed, census after census (1996 to 2011) shows more people of family age (parents and guardians 30 to 50 years of age as well as children 0 to 15) move into the area than move out. Read more by going to the Articles tab
3Enrolment table, Qualicum School District (69), 1992/93 to 2013/14 numbers (.xls)
4Analytic Activities At Statistics Canada, Ivan Fellegi, former Chief Statistician, Statistics Canada, Conference Of European Statisticians, June 1999
