by William Warren Munroe, January 2008
This presentation is meant to highlight some fundamental demographic changes that are occurring both locally and globally. Also, this is an opportunity for people to become more familiar with data sources and how to explore data to gain insight into the character of our communities.
Everyone can be, and should be, an expert in demographics for the jurisdiction they live in, and be able to compare it with others, both big and small in area and or population. By encouraging the examination and discussion of demographics and in particular the components of population change, made up of births and deaths, as well as migration in and out of an area, we will improve our ability to plan. Understanding demographic statistics is at least as important as hockey statistics.
It is my hope that when we get together to discuss planning options, whether for opening or closing educational or health care facilities (among other issues), that if we have questions about demographics and various attributes, we will be able to look at the relevant data right away. For example, the census data can be viewed via the internet. If we have further questions, we can see the actual survey questionnaire, allowing us the opportunity to better understand the results.
I think it is important that citizens have access to demographic statistics (made anonymous with no reference to individuals). I remember going to meetings where the government official or a representative from an organization came armed with the "statistics" thereby, describing the situation we were to address; however, these statistics are not always correct. I worked for government and know that the information is not always sound and therefore it is important that citizens be able to have access to relevant data, thereby improving the understanding of the strengths and weaknesses of the data, and improving the quality of the decisions made. As you know there are lies, damn lies and statistics. It is important that the statistics not be in the hands of the few, but rather that the statistics be open and verifiable.
This presentation looks at the changing age distribution, the number of people by single year of age, between 2001 and 2006 for Canada, British Columbia, and Alberta, as well as the Nanaimo Regional District, the Parksville Census Agglomeration, and the Town of Qualicum Beach.
The census results are viewed using various lenses so that we can also see total net migration and the differences between male and female net migration. Also a comparison is made between the declining natural change (increase number of deaths and low birth rate) on the west coast, with what is occurring nationally and internationally.
With the oldest population in Canada, the Parksville Census Agglomeration provides insights into the future for the ageing nation. The Parksville CA can be characterized as a high turnover community subject to fluctuations in population change. The increasing number of deaths in combination with out-migration could exceed the low number of births and lower in-migration during the next downturn in economic activity.
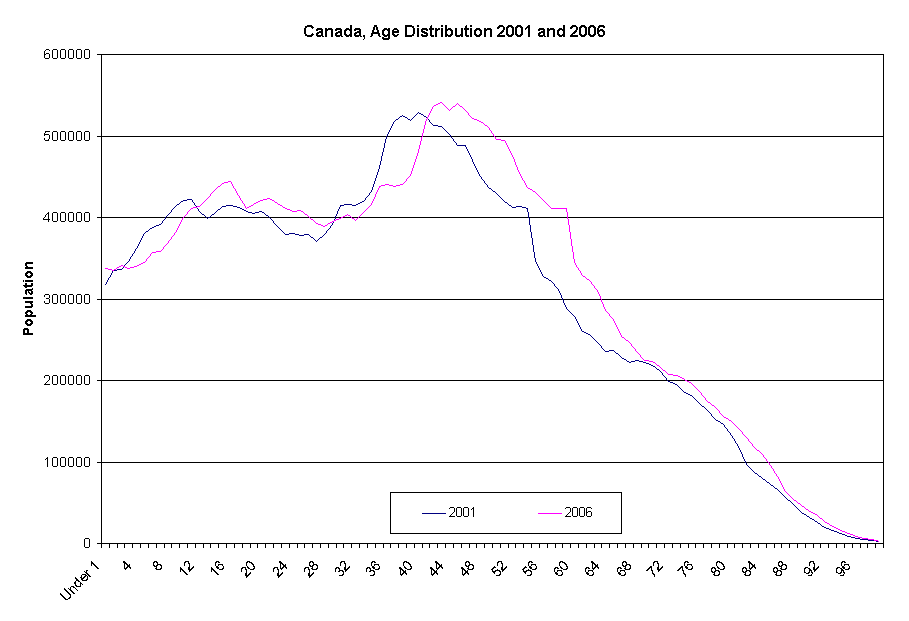
First of all, I would like to show you the age distribution for Canada as estimated by the censuses for 2001 and 2006 available on the Statistics Canada website.
If we compare 2001 census results with the 2006 numbers, we see that the largest number of ‘baby boomers’, those born in the early nineteen sixties, have aged from their early to mid-forties. The post war ‘baby boom’ came to an abrupt end in the mid to late nineteen sixties resulting in a rapid decline in births and a much lower number of people now in their late thirties and early forties. The baby echo, children born to the baby boomers, peaked sixteen years prior to the 2006 census, in 1990, and these people are now moving into high school age.
We are currently experiencing a time of far fewer young children in Canada; however, the decline appears to have ended as there were more children under three years of age in Canada in 2006 then in 2001.
 Source: Adapted from Statistics Canada by W.W. Munroe
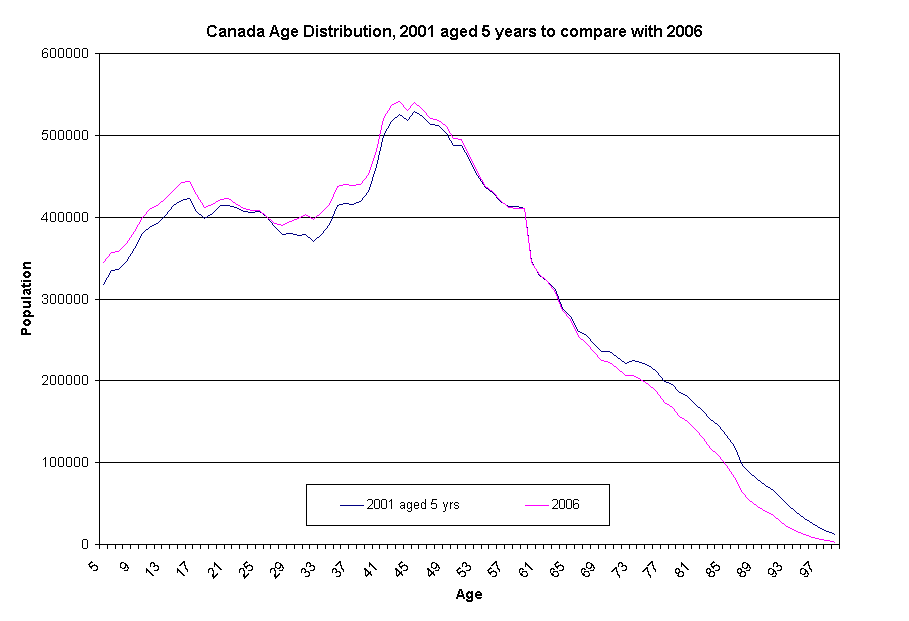
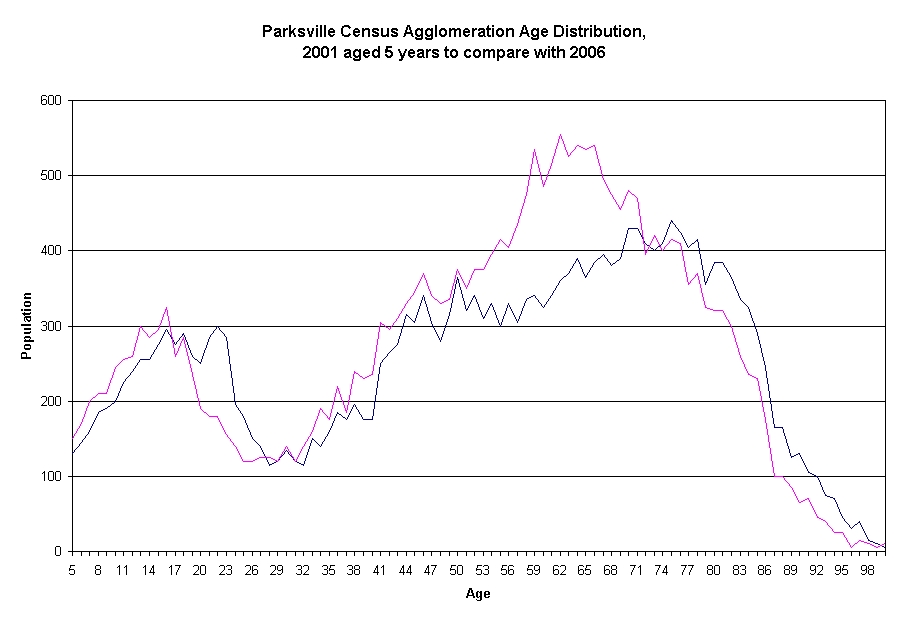
Another way to look at possible trends in population change is to take out the influence of the oscillations in births. By aging the population from 2001 by five years we can compare the numbers with the 2006 census results. In this manner, the differences can be highlighted to show changes in the population due to migration and deaths. This ‘signature’ helps describe the character of an area.
In order to age the population from 2001 by five years, we simply take the number of people for each single year of age (under 1 to 94 years of age) from 2001, and compare these years with the number of people five years older (5 to 99 years of age) in 2006.
For example, the number of people under one in 2001 are assumed to be 5 years of age in 2006, and those 15 years old from 2001 are assumed to be 20 year olds in 2006. If no one died or moved between 2001 and 2006, the numbers would be the same. After aging the 2001 results five years, the lines in the following chart follow each other very closely but not exactly.
 Source: Statistics Canada; Prepared by W.W. Munroe
The difference between the two lines is due to migration and death. The only way that there can be more people than expected is through positive net migration (more in-migration than out-migration), while negative numbers could be due to more out-migration than in-migration and or death.
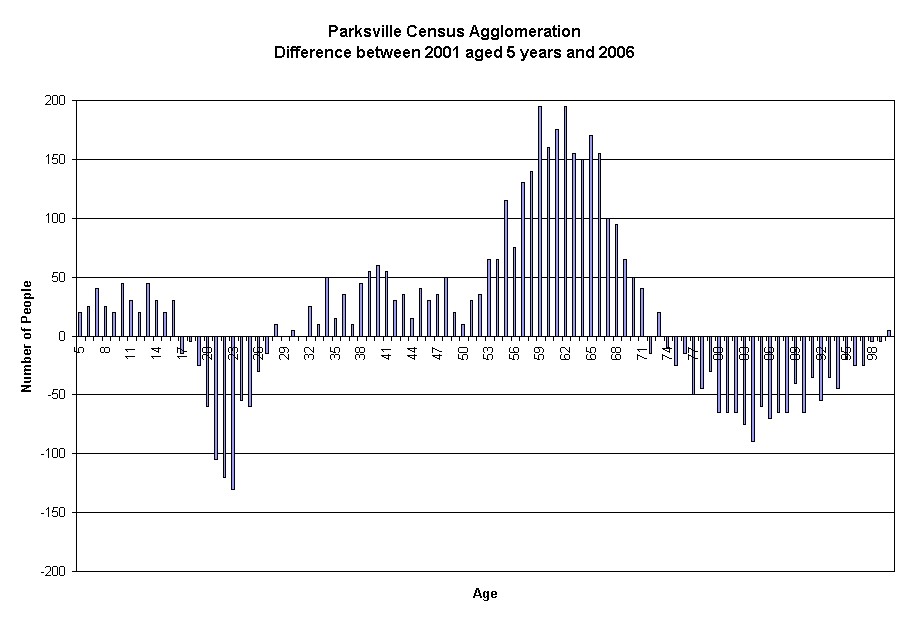
The difference between the two sets of numbers can be represented in another chart. In the following chart, we can see the difference between the 2001 numbers aged five years and the 2006 numbers. I refer to this difference as the population signature.
 Source: Statistics Canada; Prepared by W.W. Munroe
The Canadian Population Change Signature for the 2001 to 2006 time period, based on the census figures, shows that Canada has more people than expected between 5 and 17 years of age and those 28 to 53 years of age. As mentioned, the higher numbers can only be due to more in-migration than out-migration. Interestingly, Canada is not as attractive to people in their mid 20's.
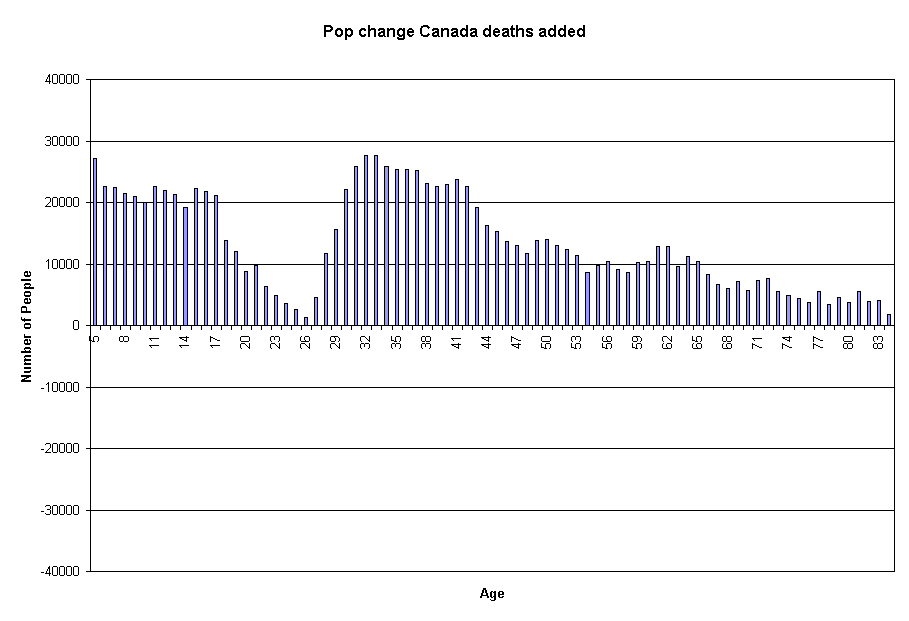
What would the population signature look like if there were no deaths. If we add deaths back in, we can see total net migration.
 Source: Statistics Canada; Prepared by W.W. Munroe
With deaths added back in, the chart above represents net migration. Canada is attractive, with more in-migrants than out-migrants, for all ages to varying degrees. Naturally, the impact of deaths increases as people age. With deaths added back in, we see that the number of people over 50 years of age remains positive.
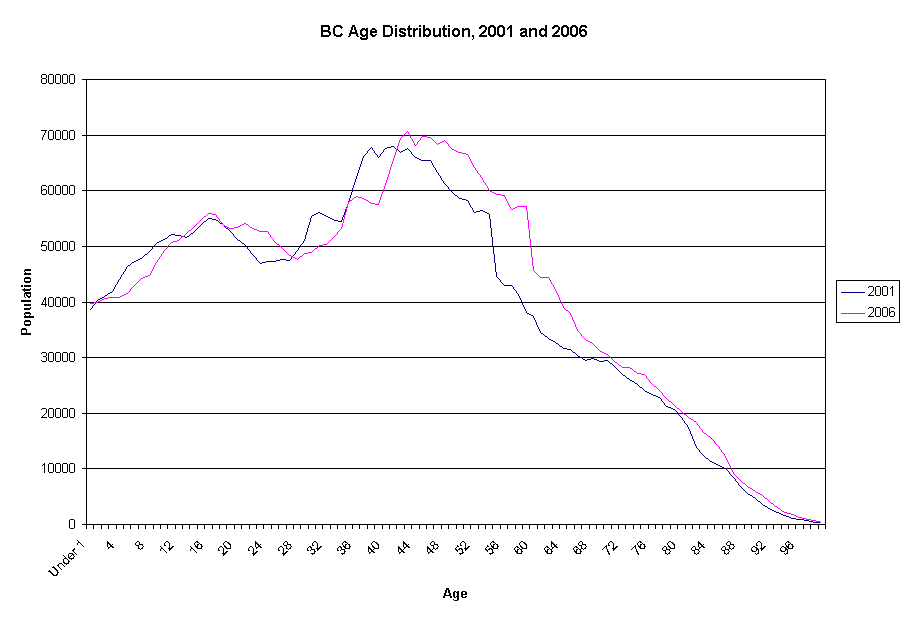
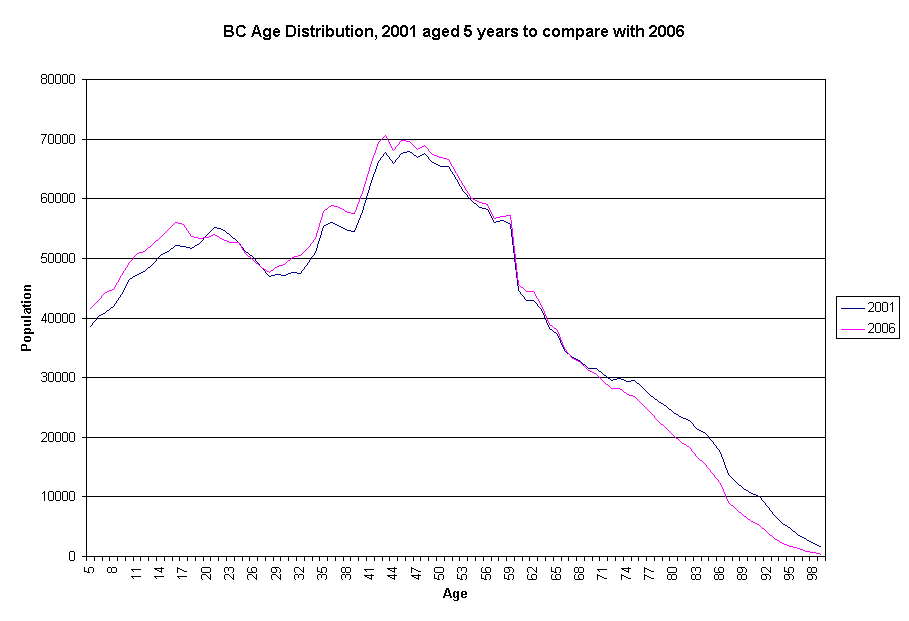
Much of the fluctuation that we see in our communities is reflected in the difference between BC and Canada’s signature from 2001 and 2006. BC has two distinct differences when compared to the Canada Population Change Signature for the 2001 to 2006 time period. There is 1) more out-migration for the 18 to 25 age group, and 2) more in-migration for the 55 to 65 age group. First, let us take a look at the age distribution for BC for 2001 and 2006.
 Source: Statistics Canada; Prepared by W.W. Munroe
When we age the BC population from 2001 by five years to compare with the numbers estimated in the 2006 census, we see that the lines are close but not the same, as in the Canada example.
 Source: Statistics Canada; Prepared by W.W. Munroe
 Source: Statistics Canada; Prepared by W.W. Munroe
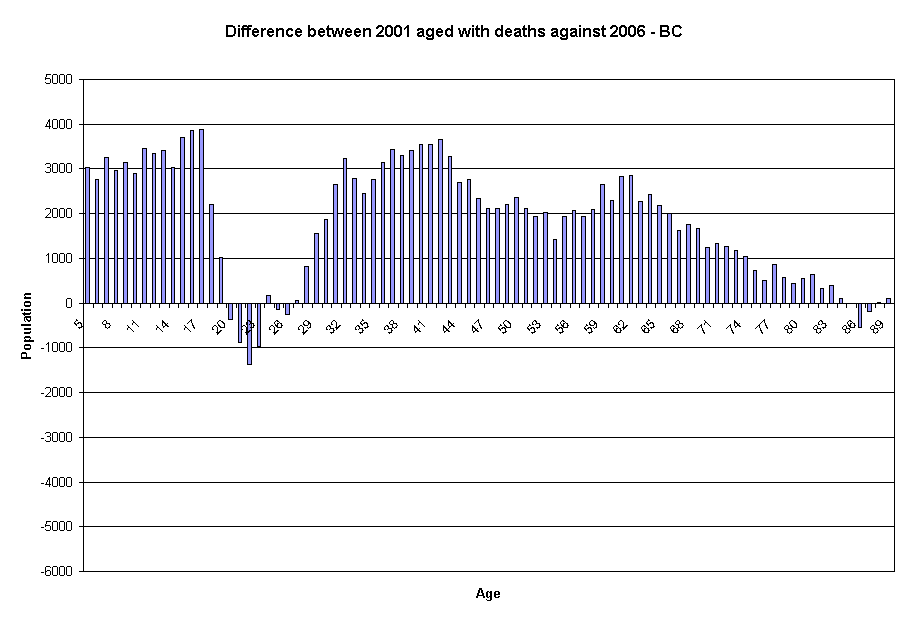
Now, with deaths added back in, we see net migration for BC between 2001 and 2006 by single year of age. During this time period, BC gained people in all but two age groups. An observant Chamber member noted that there are negative numbers (more out-migrants than in) for some 80plus year olds. It was suggested that some people move out to be reunited with family in other provinces. Also, more 20 year olds left than came to the province.
 Source: Statistics Canada; Prepared by W.W. Munroe
BC is subject to fluctuations in migration. BC is very vulnerable to fluctuations in commodity prices as it is primarily a resource based economy with much less secondary and even less tertiary refinement of raw resources. When commodity prices are high, there is more work available and higher wages; therefore, people stay and more move in. On the other hand, when prices are low, there is less work and lower wages and more people move out. Commodity prices and net migration dropped until the late 1990s, and began to recover in the early 2000s. Net interprovincial migration was most negative in 1999 at -14,610, becoming positive in 2003. For BC, the recent increase in economic activity and migration has been dampened due to the rapid decline in wood processing as well as the strong Alberta economy. The next downturn in economic activity will likely be as steep and deep as the last. For a more full description please read the article I wrote for the provincial government on Migration between Core and Peripheral Areas
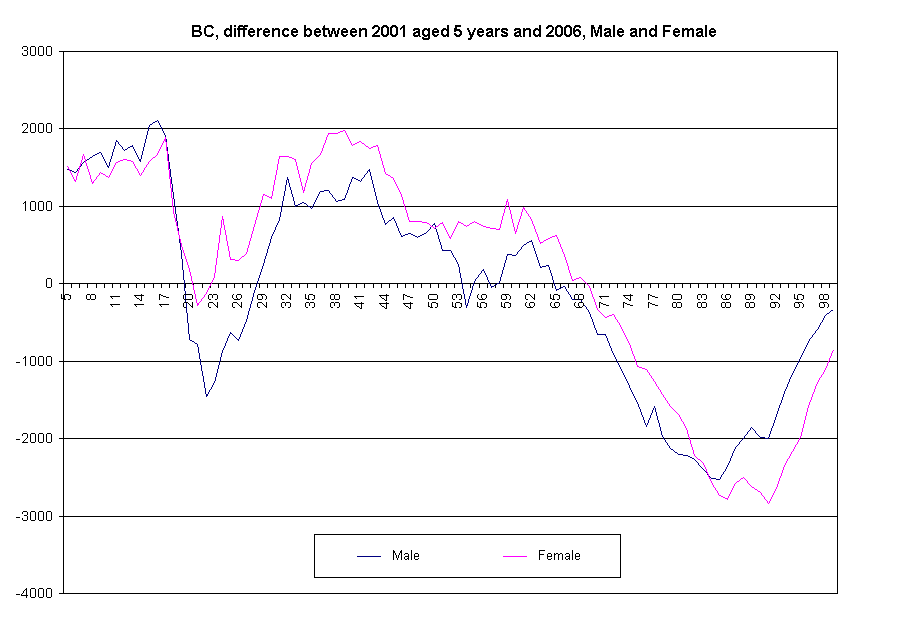
A closer look at BC Population Signature by sex shows that there was an increase of nearly 3 (2.7) females to every 1 male in the 20 to 65 age group between 2001 and 2006. The increase in the number of males was kept down not only because they are less interested in moving to, or staying in, BC, but also because many more males (approximately 7,700) died than females for this age group between 2001 and 2006. The following chart shows the difference between the 2001 numbers aged five years to compare with 2006 without deaths added back in.
 Source: Statistics Canada; Prepared by W.W. Munroe
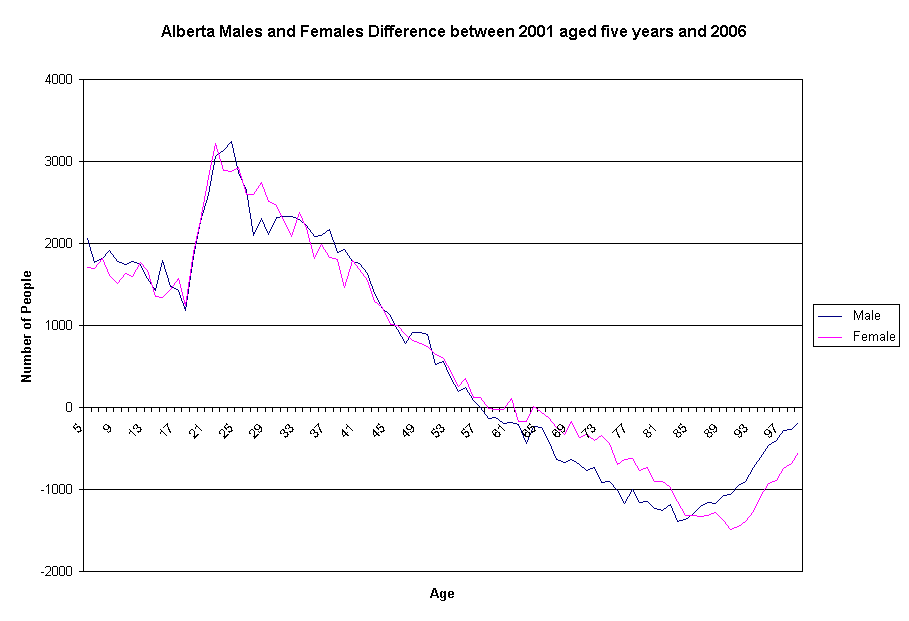
The population signature for males and females differed between 2001 and 2006 for BC. There are more males than females of school age and a immediate and rapid reversal in the late teens with far fewer males than expected. Males and females remain separate with some variations particularly for the 50 year olds. On the other hand, for Alberta, males and females move much more closely. Also, although Alberta had a smaller 2006 population (3,290,350) than BC (4,113,485) Albertans have had more births than BCers since 2005. Preliminary estimates found in the Annual Demographics Compendium from Statistics Canada show that in 2006, the number of births in Alberta (41,989) exceeded births in BC (40,926).
 Source: Statistics Canada; Prepared by W.W. Munroe
The BC Population Change Signature is very different from that of the province of Alberta for the time period of 2001 to 2006. The out-migration of young adults from BC likely contributes to the in-migration of this age group to Alberta. On the other hand, people in their early retirement years of 55 to 65 are moving out of Alberta, while they are moving into BC.
 Source: Statistics Canada; Prepared by W.W. Munroe
The population change between 2001 and 2006 varied considerably within Canada.
Add to the oscillation in age distribution, the boom and bust nature of a resource based economy, and variations in migration for people of different age groups, Central Vancouver Island is far from a stable area in terms of population, but rather can be best described as a dynamic, fluctuating, high turnover region.
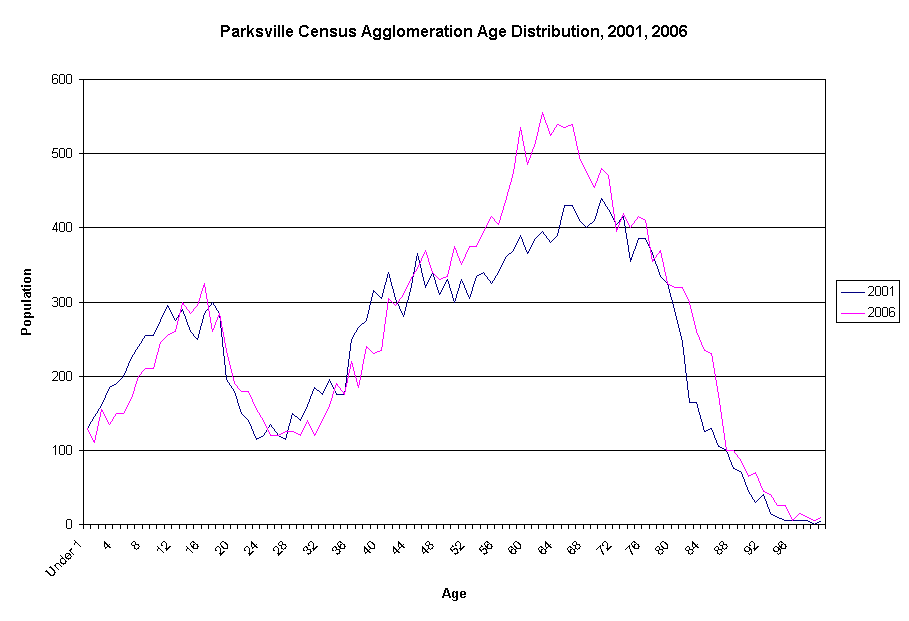
Locally, for the Parksville Census Agglomeration which includes Parksville, Qualicum Beach and Nanaimo G, the two features that distinguish the BC and the Canadian Population Signatures are further accentuated with a relatively larger portion of the 18 to 25 year olds leaving, as well as a larger portion of retirees moving into the region. Let's take a look at the age distributions and the Population Signature.
 Source: Statistics Canada; Prepared by W.W. Munroe
 Source: Statistics Canada; Prepared by W.W. Munroe
 Source: Statistics Canada; Prepared by W.W. Munroe
While the number of people in their late teens and early twenties leaving exceeded those moving to the Parksville CA by approximately 620 between 2001 and 2006, the area did attract some families as indicated by the increase in in-migrants between 26 to 46 years of age and those 5 to 17 years of age. However, the proportion of families is much smaller than the Canadian average.
The in-migration of families has buoyed the population of young school aged children, but not enough to stop the decline in school enrolment due to the low number of births. The number of births often increases with increased economic activity; therefore, there may be an increase in enrolment for elementary schools in the area in the next few years.
I have asked Statistics Canada for the number birth and deaths to the CMA/CA level and the census sub-division level (municipalities) but this is not available for free to the public. Rather, individuals would have to pay approximately $1,000 each for this vital information. I find it interesting that while more responsibilities are being divested to the local level, citizens do not have ready access to basic demographic information.
For the Parksville CA, migration contributes to the growth in the area’s population. On the other hand, based on the information at the Regional District level (referred to as Census Division by StatCan), I think that we can safely assume that deaths increasingly exceed births. When referring to the Parksville Population Signature, the number of people in the 50 to 69 year old age group increased by over 2,000. Death exceeded in-migration in accounting for the negative numbers for people over 70 years of age.
Within the Parksville CA, the town of Qualicum Beach grew in area between 2001 and 2006 to include close to one thousands more people. Comparisons of population for small areas are difficult because of changing boundaries. Between 1986 and 2006, the town's boundaries changed in 1987, 1994, 1999, 2001, 2004, and 2005. The total population for the town grew from 5,137 people in 1991 to 6,734 in 1996, to 6,921 in 2001 and to 8,502 in 2006.
If the people added to the town through the expansion of the town boundaries in 2004 and 2005 are not included in the 2006 figures in order to compare total population more accurately between 2001 and 2006, the 2006 total population would have been around 7,575. The following charts show the population change since 1991; however, adjustments to the population are not made for the boundary extension in 1999 and 2001. Therefore, please view this chart as emphasizing the change in growth rate rather than absolute values. It is possible that the boundary expansion in 1999 and 2001 added people to the estimated population of the town (if so please let me know). This would mean that there was less growth between 1996 and 2001 and more growth between 2001 and 2006 and would also mean that there is even a greater fluctuation in growth rates.
 Source: Statistics Canada; Prepared by W.W. Munroe
The total population has changed at different rates over the years. In the early 1990's there was an economic boom in BC and the migration to the province and to Qualicum Beach was high; however, the decline in commodity prices and loss of well paying jobs resulted in a much slower growth in the late 1990's to 2001. An adjustment has not been made for people who may have been added to the town due to the boundary expansion in 1999. The following chart, with 2006 population adjusted, shows that Qualicum Beach has experienced times of high growth and times of low growth.
 Source: Statistics Canada; Prepared by W.W. Munroe
The town of Qualicum Beach is very attractive to people who retire and those who do not have to live close to their place of work. A comparison of change in the number of males and females between census years can not be made easily due to the boundary changes. Also, it is difficult and expensive to get data on the change in number of births and deaths to the CA and municipality levels. Nonetheless, it is likely that the number of deaths is continuing to increasingly exceed births. This means that there is a high turn over of the population with retirees moving in and people dying. Therefore the housing stock need not change very much to accommodate in-migrants. If anything, multiple unit dwellings will be in greater demand while single family dwellings will be less attractive.
Now that we have looked at the change in the age distribution, it will be fruitful to look more closely at the changes in the components of population change. There are only two ways that total population can change for a specific area: 1)Natural Increase made up of births and deaths; and 2) Migration in and out of an area.
As the expert on migration for the provincial government, I forecasted that the Nanaimo Regional District(RDN), and the Parksville CA would continue to have overall positive net migration to 2036. The RDN attracts people from across the country, most of whom arrive from the Greater Vancouver RD and the Capital RD including Victoria, particularly during boom times. During bust times the RDN tends to attract more people from more peripheral/rural areas.
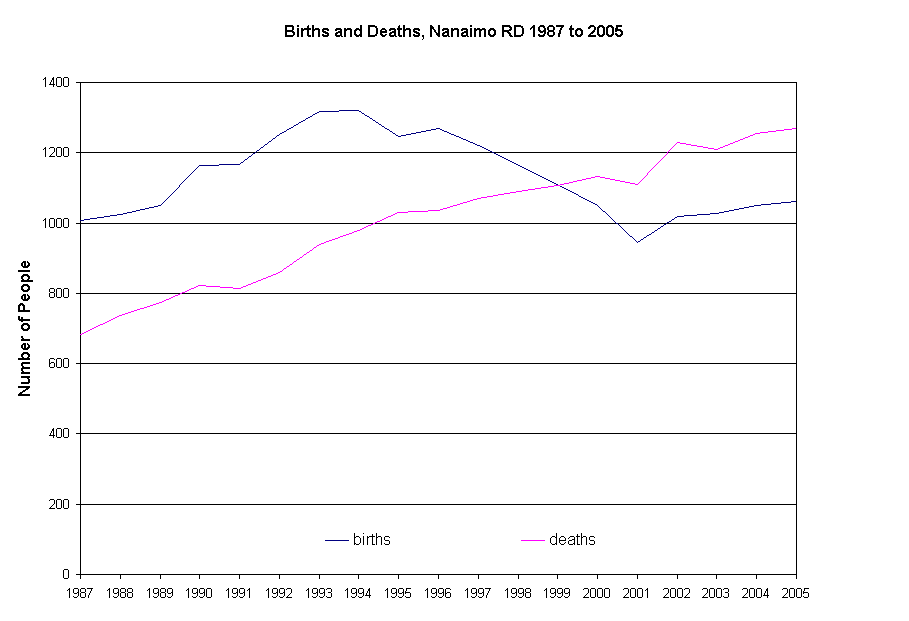
However, the rising number of deaths began to exceed the declining number of births for the Nanaimo Regional District in 1999. The following chart shows the changes in the number of births and deaths for the Nanaimo Regional District.
 Source: Statistics Canada; Prepared by W.W. Munroe
No longer does this area have continuous population growth from high replacement rates. Indeed, the decreasing birth rate and the increasing death rate means that natural increase (births minus deaths) is negative for the Nanaimo Regional District.
The total population of the region is being eroded by more deaths than births, and natural increase will likely continue to decrease. Perhaps the language of demographics will change due to the changing reality. Perhaps, the term "natural increase" should be changed to "natural decrease". A term to recognize the possibility of increases and decreases would be "natural change". For the Nanaimo RD, Natural Change is negative.
 Source: Statistics Canada; Prepared by W.W. Munroe
This phenomena of a declining natural change is shared with other areas of the world. Indeed, the first signs of a decline in natural change here on the west coast of North America are reflected in the global human population growth rate. Perhaps the changing attitudes regarding reproduction are related.
 Source: United Nations Population Division/DESA, to the Second Committee of the Fifty-fourth Session of the General Assembly (19 October1999); Prepared by W.W. Munroe
Globally, the human population growth rate is declining. Of course there are some places experiencing increases, but there are others that are beginning to have a decline in population. It is interesting to note that rapid population growth began earlier in Europe than other continents and is forecast to decline there first.
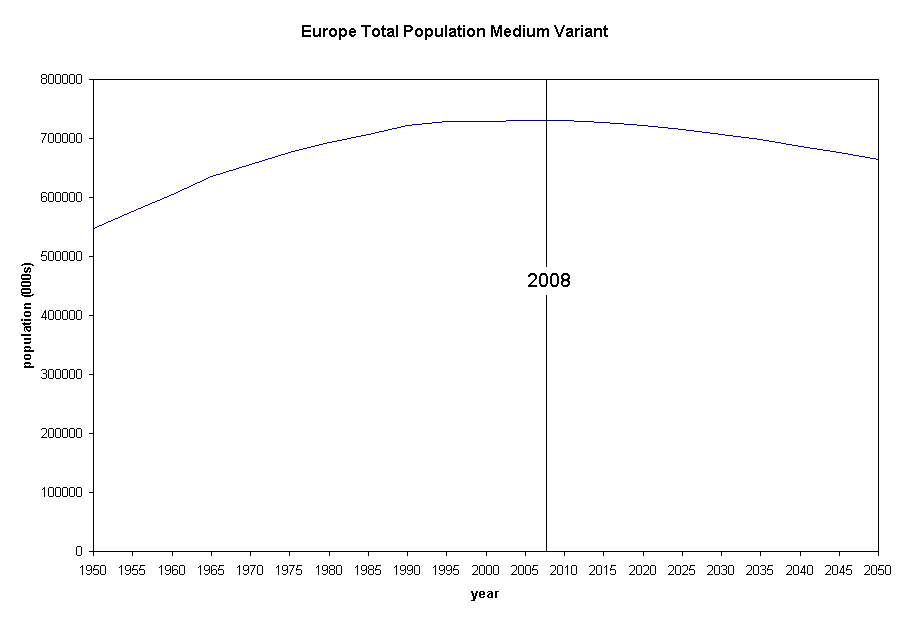 Source: United Nations (2006); Prepared by W.W. Munroe
Locally, on the west coast of Canada, deaths will likely continue to exceed births leaving net migration to contribute to the population. There will likely be fluctuations in migration due to fluctuations in economic activity. Migration between BC and other countries will likely also fluctuate as economic activity increases throughout Asia. The west coast will likely continue to attract people 55 and older while young adults continue to set speed records when leaving.
Globally, the declining growth rate may result in a stable population in a few hundred years. Until then human impacts on the environment will keep pace with the population growth. While growth may slow, and the total human population may even become stable, there will likely be considerable internal variation around the world. Indeed, a stable human population may result in increased variation since the consistency created by rapid growth will no longer have as much influence.
Some links about population include...
- Statistics Canada's website
- United Nations Population website
- United Nations Population database website
- Wikipedia website