In February 2012, the 2011 Census results will be released by Statistics Canada. While the census provides total population and dwelling numbers, comparisons with previous census numbers reveal important information.
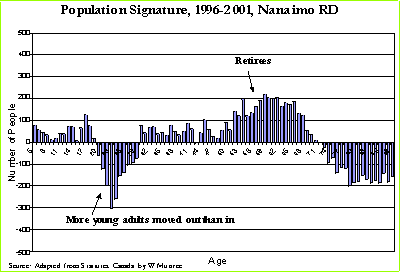
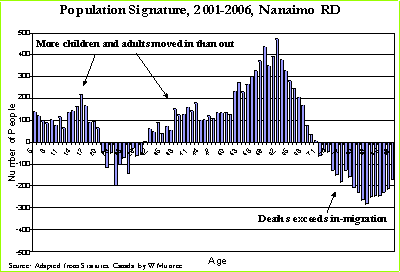
For example, my "Population Signature" charts highlight net migration of people by single year of age between census years. Move your cursor over the following Population Signature charts for the Nanaimo Regional District (RDN) to see the differences between 1996 to 2001 and between 2001 to 2006. For larger charts, click the little charts in the left navigation bar.
During the economic down turn in the late 1990's, more young adults, 18 to 25 years of age, moved out rather than into the Region, with many leaving for more populous areas like Vancouver, and many moving out of the province. In the latter time period, from 2001 to 2006, fewer young adults moved out of the region, and more families (children of school age, 5 to 17, and adults of working age, 26 to 55), as well as retirees, moved in.
Population analysis provides the foundation upon which social and economic activity can be examined and forecasted. Analyses of the factors influencing the components of population change (births, deaths, and in and out migration by age and sex) allows insights into changing demands on public and private services, including opening and closing of education and health facilities, as well as residential and non residential construction, transportation, electrical generation, etc.
As mentioned, Population Signatures provide information useful when considering the opening and closing of education and health facilities. In the Qualicum School District, the idea that the area is attractive to retirees and not families helped justify the recommendation to close the only high school in the Town of Qualicum Beach. But are more families moving out than in? See the Parksville /Qualicum area Population Signatures.
Population Signature charts can be created for administrative areas from communities and municipalities to provinces. What will the 2011 census reveal for your area?
Here is an explaination of how the Population Signatures are created.
For more information or to prepare for the up coming census release, send an email to wmpopulationanalysis@shaw.ca.

