Statistics Canada has released the 1st Quarter, 2011, preliminary estimates of the components of population change for the provincial and territories.
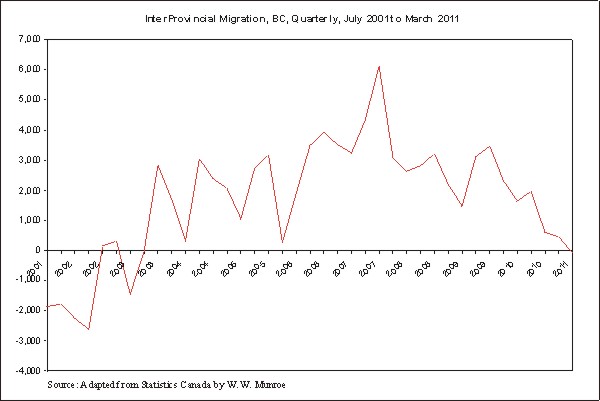
Between January 1, 2011 and March 31, 2011, Statistics Canada estimates net interprovincial migration (in minus out) was marginally negative for BC, at -98.
Interprovincial migration is an excellent indicator of the boom and bust economy in BC. With little secondary and particularly tertiary refinement (manufacturing, including ship - ferry - building) of raw resources, BC will likely experience as deep a decline as during the last bust.

The most positive net interprovincial migration during the last "boom" was 6,127 in 3rd quarter of 2007.
The return to negative net interprovincial migration is an indicator of the return to bust side of the economic cycle.
The previous quarter with negative interprovincial migration was in 2003, after BC experienced more out migration than in migration from other parts of Canada, through the late 1990ís and into the early 2000ís.
Sources:
Quarterly population estimates and factors of growth, provincial perspective - British Columbia
Table 3-11, Quarterly estimates of demographic components, provincial perspective - British Columbia http://www.statcan.gc.ca/pub/91-002-x/2011001/t344-eng.htm
Quarterly Demographic Estimates - http://www.statcan.gc.ca/bsolc/olc-cel/olc-cel?catno=91-002-X&chropg=1&lang=eng