Population Analysis benefits from contributions from Population Geography and Demography. Both disciplines look at human population and the components of population change; however, the approach and emphasis does differ.
The main difference between Population Geography and Demographics is reflected in the methods used to calculate population change, and more specifically migration.
Demographics focuses primarily on births, deaths, and a residual (migration) to calculate population change. It was not long ago that some Demography Schools did not study migration in favour of fertility and mortality.
To calcuate population change, Demographers would use birth and death numbers over a time period, to add to and take away from the last total population count.
If the next total population count differed from the calculation, the left over bit, referred to as a residual, was considered to be net migration.
The calculation looks like this ...
- P2 = P1 + B - D + Residual
- where P1 is total population at time one;
- where P2 is total population at time two;
- where B is the number of births;
- where D is the number of deaths;
- where Residual is the number left over, where the change in total population not accounted for by births and deaths, made up of migration and counting error.
If the count was not correct (error in counting is possible) then the residual contains both the error in counting and net migration. (I know of at least one population expert working for an Official Statistical Agency who considers migration to be a "garbage can".)
The left over bit, net migration, is made up of in-migration minus out-migration. Net migration alone can be very deceiving. Net migration can be zero (0) even though large portions of communities have moved out and have been replaced by the same number of people from other areas.
For example, in a town of 10,000 people, each year 100 young adults (18 to 25) could leave with no young adults moving in and instead 100 people over 65 move in and no one over 65 moves out.
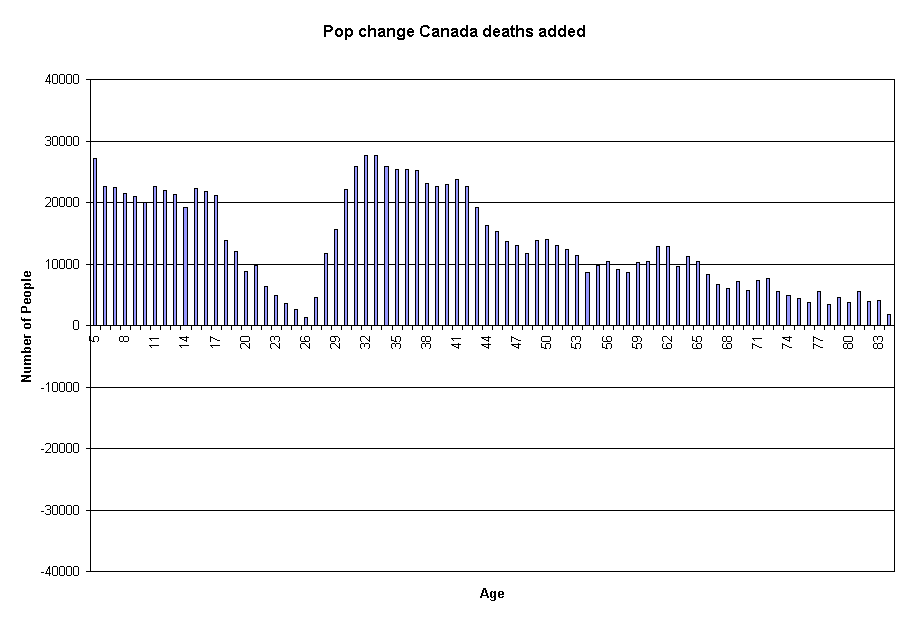
After 10 years the complexion of the town can change considerably while net migration can be near 0. Net migration can hide large migrations. Here is a chart showing net migration, by single year of age, for Canada between 2001 and 2006:

Source: Adapted from the 2001 and 2006 census counts from Statistics Canada by W. W. Munroe. For a description of how the numbers were calculated, see the presentation to the Chamber of Commerce, 2008.
Chart 1 shows that the age group that moves the most appears to move the least.
With "in" plus "out" migration numbers (gross migration), the chart would show large numbers of young adults moving in and moving out; however, migration by age out of Canada is difficult to count. The census does not count emigrants.
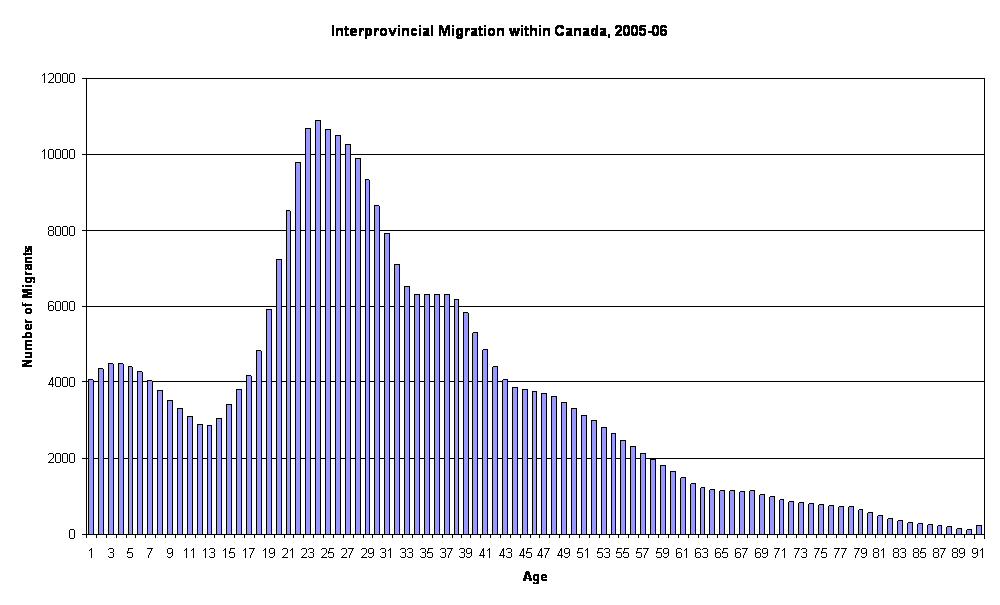
An easily accessible confirmation of the relatively large amount of migration of young adults, is found in that Annual Demographic Compendium from the Demography Division of Statistics Canada. By looking at the number of migrants moving from one province to another within Canada we can see the relatively large amount of migration for young adults.

Source: Statistics Canada, Demography Division, Annual Demographic Compendium, 2007
Important dynamics impacting communities can be missed when looking at net migration or the residual. Population Geography takes into consideration both in-migration and out-migration by single year of age, or broad age groups, by sex; therefore, gross as well as net migration can be calculated. Such additional information can provide insight into the difference between communities with stable versus those with high turnover populations.
The old way of thinking about population change is still referred to by some demographers. Some official statistical agencies, such as BC Stats, still uses this method":
The lack of information on "in" and "out" migration by age and sex required such methods. With the improvement in the information from sources such as the census long form from Statistics Canada, more light can be cast on the dynamics of population change. Consequently, many Demographers have revised the residual method because of improved data.
Population Geography is an integrationist discipline providing insight into human to human interaction in relation to human interaction with the environment. Examples include studies in rural and urban interactions, independence versus interdependence, as well as societal expansion and contraction phases, verticle versus horizontal integration.
Population Geography provides the foundation for studies in Human Geography and benefits from sound quantitative methods. Human Geography is a part of the social sciences, which utilizes scientific methods to better understand human activity. Population Geography welcomes the ground truthing of theories to check for ecological fallacies.
Population Geographers begin with an examination of the components of population change including births and deaths, as well as migration in and out of areas, whether internationally, nationally, or within regions. The number of people by age and sex, the number of births and deaths, and the number of migrants in and out of an area by their age and sex, forms the basis upon which social and economic activity, in relation to place are examined.
Building on the discipline of Geography, Population Geographers utilize scale, both across time and space, (era and area), to move from general overviews to specifics. Geographers map variations in human activity with reference to variations over the surface of the earth, including population density, ecosystems, administrative boundaries etc.
Geographers look for patterns in space, to see whether distributions are concentrated, dispersed, patterned or random. Geographers focus on moments in time, taking snapshots of various levels of aggregated data. Animation of snap shots help in the analysis of possible patterns.
As an integrationist study, Geographers also consider human activity in relation to ideas, as well as structure in relation to processes. For example, how do ideas regarding over-population effect our behavior? When do people change values from desire for growth and expansion to sustainability. How did European ideas about nature and political philosophy change after first contact with the First Nations of North America? Population Geographers explore changes in the numbers of peoples as well as changing ideas.
Population Analysis, benefits from both Demography and Population Geography by considering place and people equally, at least in terms of methods.
Population change is made of two parts, Natural Change and Migration and each of these can be further broken out to two parts.
Population change is made of
- Natural Change
- Births
- Deaths
- Migration
- In-migration
- Out-migration
Population can only increase due to births and in-migration while population can only decrease due to deaths and out-migration.
Happy Population Analysis