On October 2, 2010, the Qualicum School District (QSD) consultant, Matrix Consulting, presented 3 proposals, all requiring the closure of Kwalikum Secondary School (KSS), the only high school in the town of Qualicum Beach. KSS opened in 1983, nearly 30 years ago.
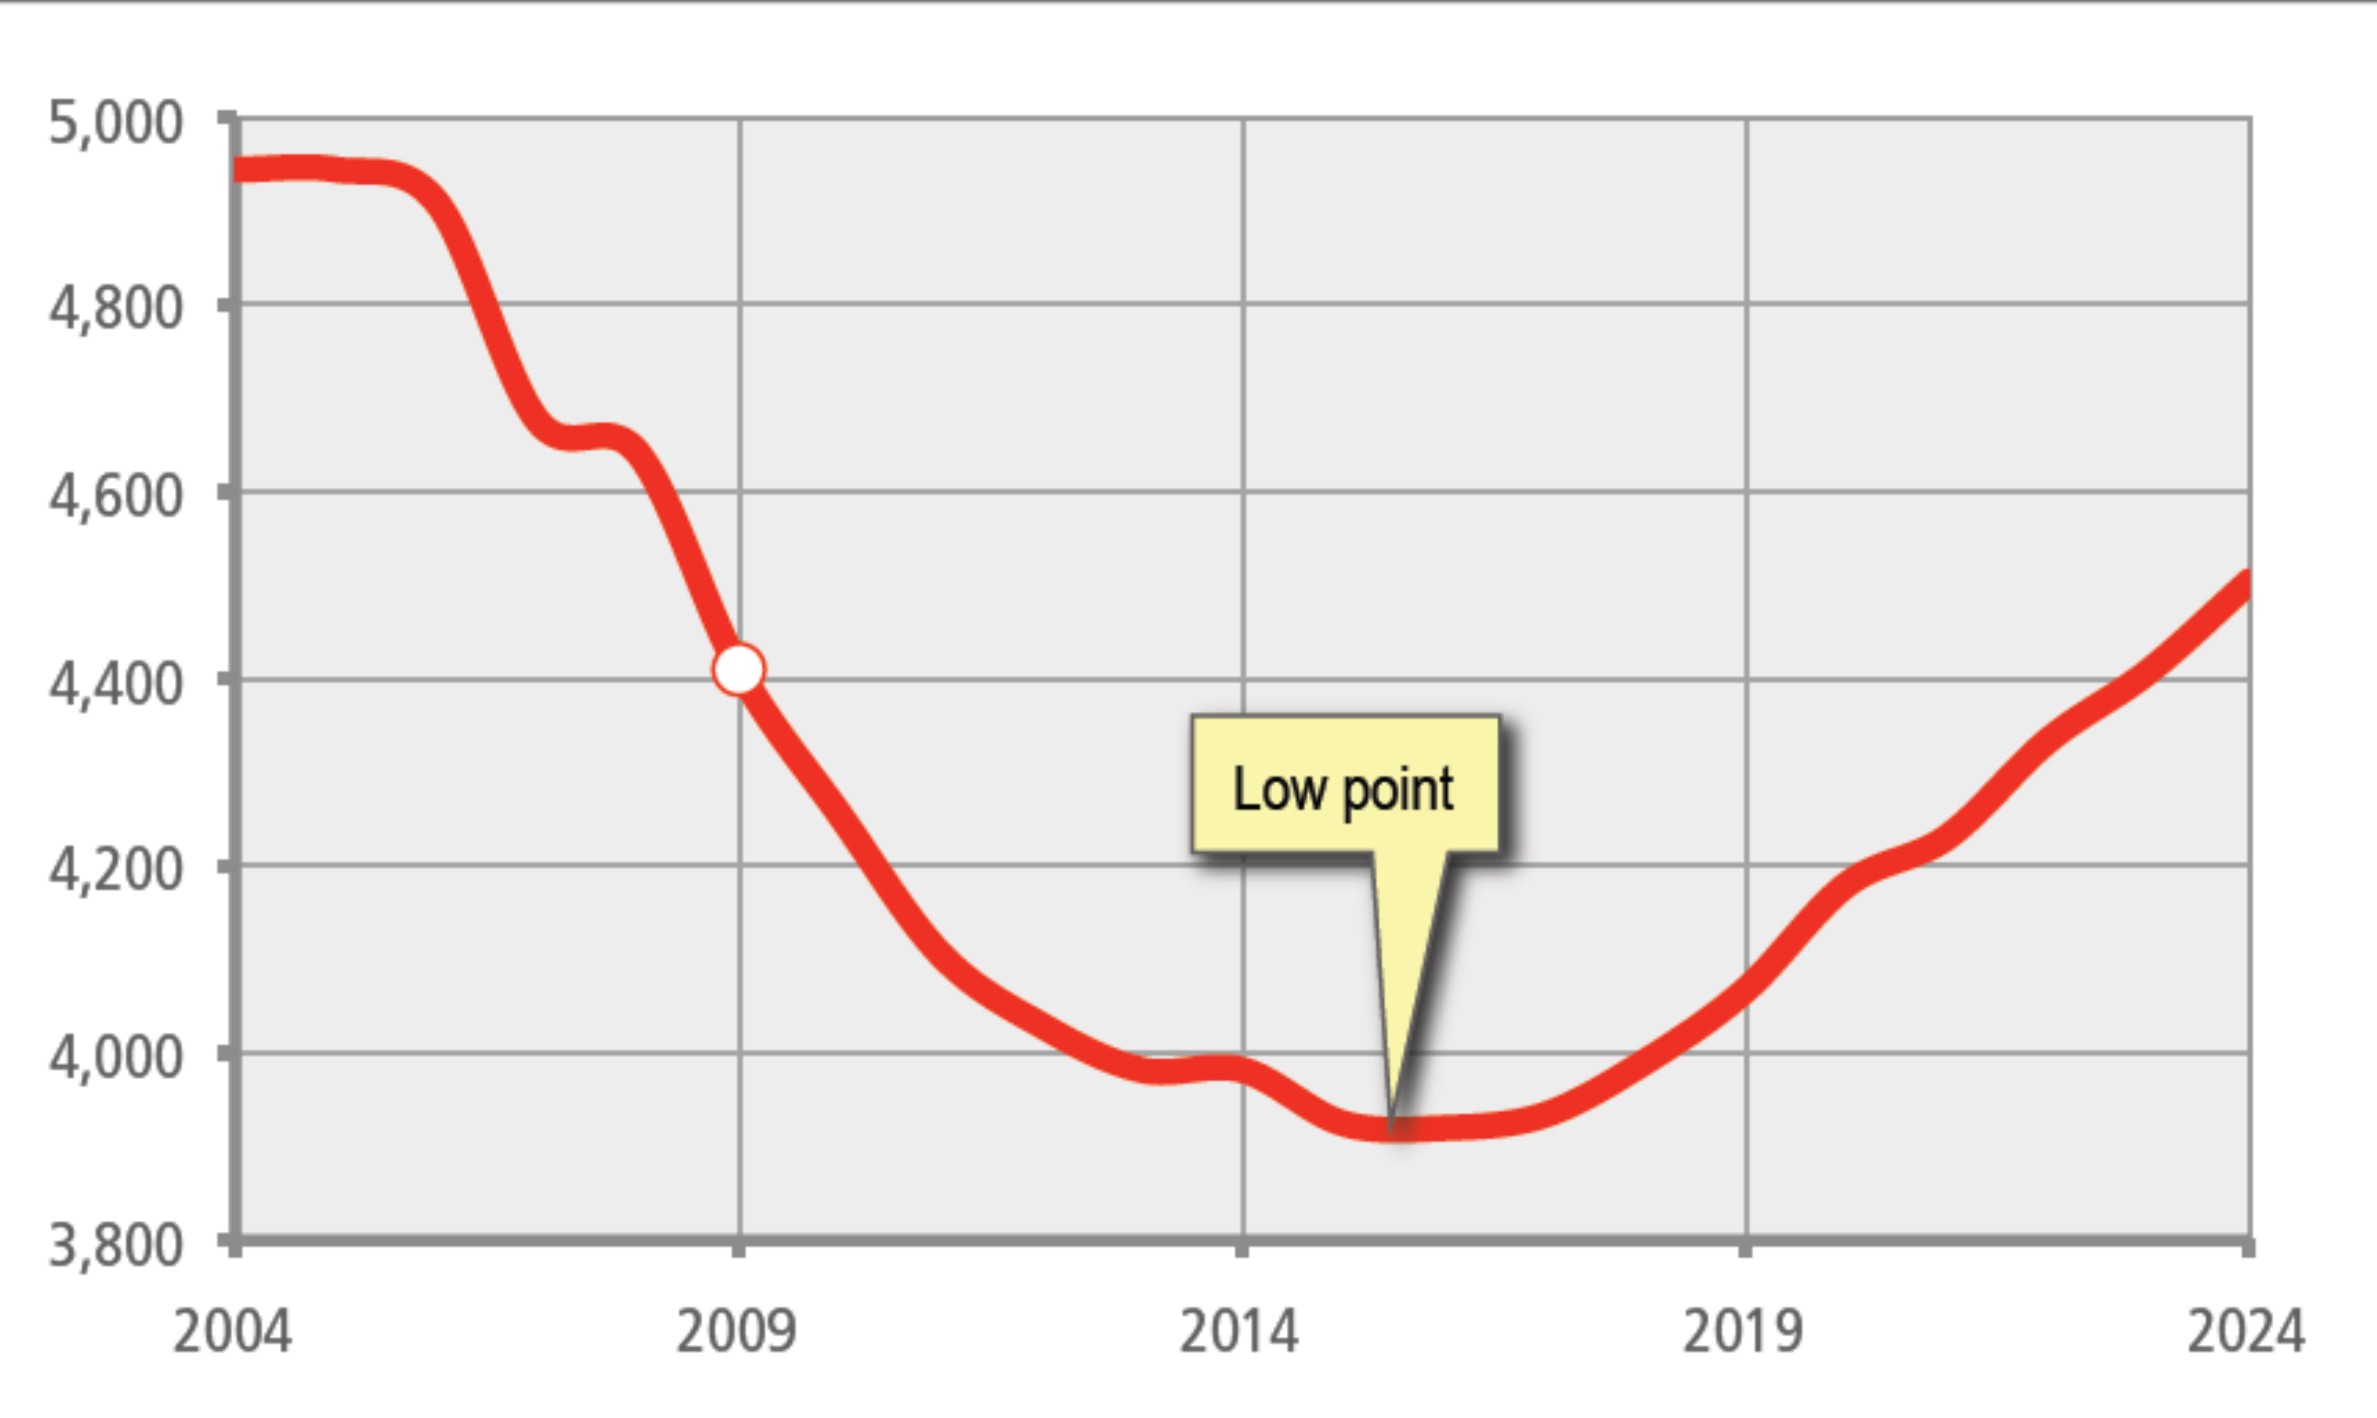
The consultant presented a chart showing a drastic decline in enrolment (Chart #1 below, from page 12 of the original report, and page 18 (with an additional line) of the final report). The chart gives the impression that the enrolment would be dropping to less than a quarter of the former highs.
Upon a closer look, not easy to see during the presentation, one can see that the y axis starts at 3,800 students, effectively removing the 3,800 students from the graphic representation of the enrolment. This chart was also printed on the front page of a local newspaper, convincing many people of the need to close the high school.
Since the chart only showed enrolment back to 2004, requests were made for total enrolment numbers by school and grade since records were kept (see endnote #1).
When enrolment numbers since 1983 were received, the additional information was added to the numbers used in Chart #1 to create Chart #2 (below and on the right). The grey area in Chart #2 indicates the same coverage as in Chart #1. For a larger view, click on the charts. To return from the larger image, click on the back button on your browser.
Chart #1, from School District Chart #2, by W.W. Munroe
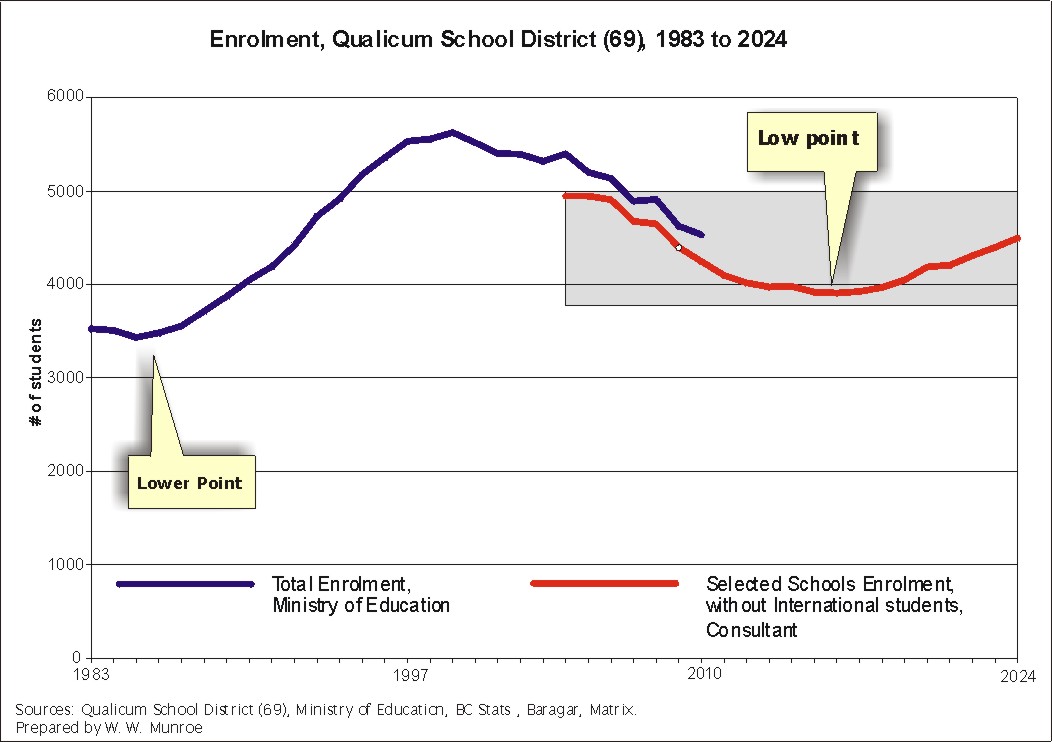
Both of the above charts represent the Enrolment Numbers for the Qualicum School District (Sd69) with a few important differences, namely...
- 1) does not include 3,800 students from the chart simply by starting at 3,800,
- 2) does not provide enrolment numbers prior to 2004,
- 3) does not have a title in the October 2, 2010 presentation. In the final report, the title is "Enrolment Forecast for All QSD Schools"; however, the chart shows the total enrolment of 15 selected schools without the International Students,
- 4) was created before the actual 2010 numbers were known.(see Endnote #2).
- 1) includes the 3,800 students missing in Chart #1, simply by starting at 0, and
- 2) includes all years since KSS opened (1983), highlighting the fact that the school district had lower enrolment in the mid to late 1980s than the forecast low point in 2015/16,
- 3) does have a title,"Enrolment, Qualicum School District (69), 1983 to 2024", and includes total enrolment for all schools,
- 4) and was created after the actual 2010 numbers were known (See Endnote #3).
Now let's add international students, historical and forecast numbers, as well as a forecast for total enrolment using the consultant's forecast numbers as a base.
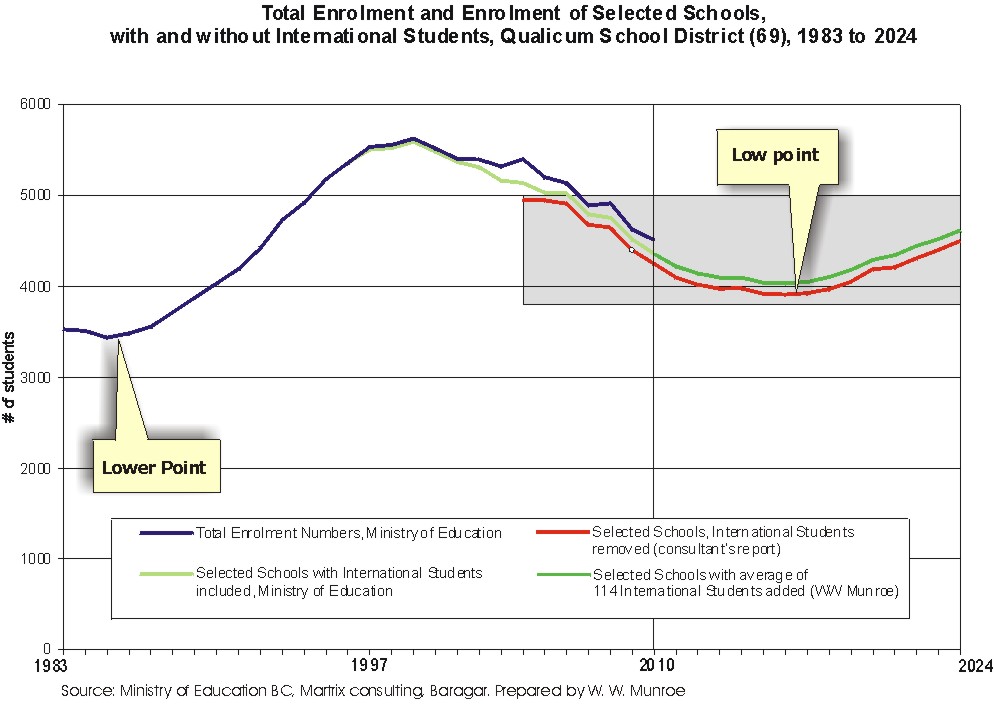
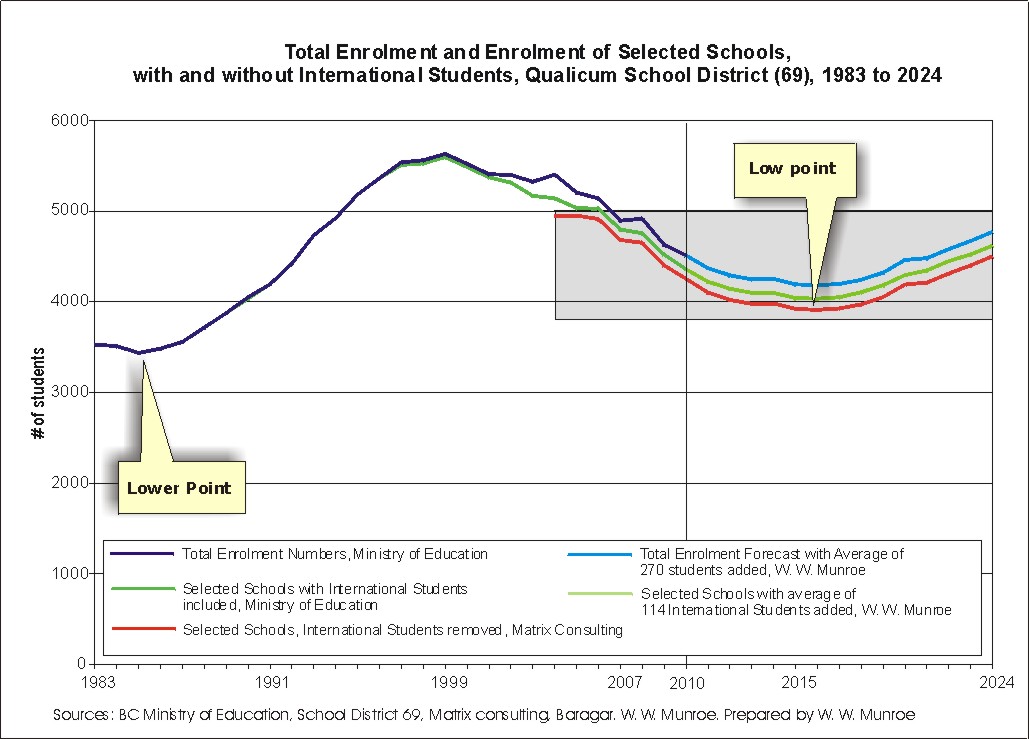
Chart #3 includes a line representing the number of International Students for the selected schools with the addition of a line representing a forecast of 114 International Students per year, (an average of the two years 2009 and 2010 with 108 and 120 International Students respectively).
Chart #4 shows the total enrolment forecast. The schools not included in the consultants report add an average of approximately 270 students with a total of 4,534 students enrolled in 2010 (See Endnote #4).
Why do the enrolment numbers rise and fall over time? What we see with the addition of the years 1983 to 2004, is the "Baby Boom Echo" that is now moving out of the grade schools, followed by a bust, with the lowest numbers currently centered in around the late elementary to early middle school ages, followed by another echo.
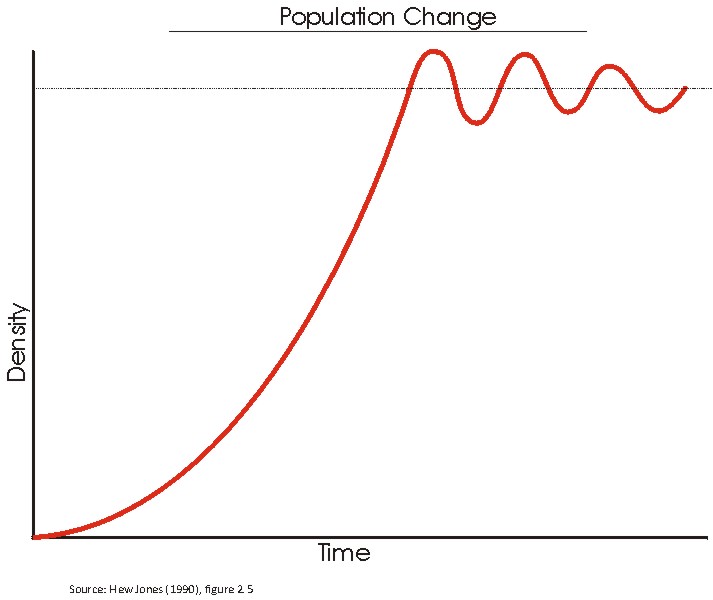
When coming out of exponential population growth, seldom if ever does the population level out right away to a flat line. The following is a chart from a Population Geography text by Hew Jones (1990) showing an idealized line of population change.
The early "Baby Boom Echoers" have already begun leaving the secondary schools and will likely increase the number of children once again. Indeed, births have increased marginally in recent years. A closer look at births and enrolment will be available soon.
If KSS did not expand to accommodate growth (the $9.1 million expansion opened in September 2003), the under-capacity argument could not have been used to justify the proposal to close KSS, made only 7 years and one month later, in October 2010. It appears likely that the current funding formula penalizes school districts that accommodate increases in enrolment, taking advantage of the decline side of enrolment fluctuations in order to justify closing whole schools permanently.
By looking at enrolment back to 1983 when KSS opened, we can see the school district has had to deal with lower enrolment before, and we can benefit from the insights of our older citizens who can help explain how they managed. In this manner, learning can be shared across age groups.
Indeed, the facilities review public consultation process provides an opportunity for community members to help address the goal of the school district, to provide the best education experience for all students. It provides an opportunity for people of all ages to learn how a fair public consultation process should, and can, work.
The consultation process, by definition, includes the two-way exchange of information and opinion. Perhaps the education system could include a program on public consultation processes, including the analysis of the factors used to justify opening or closing schools. This experience would help students learn about decision making and planning. Perhaps a financial incentive such as that provided for the "dual credit" program could be applied to a "informed and consulted" program. Such a program could be used to encourage students to complete grade 12 and could also be expanded to include an expanded international exchange program.
Charts can convey alot of information and are increasingly being used in newspapers. By printing Chart #1 on the front page, a local newspaper highlighted the importance of this graphic representation of the change in enrolment used to justify the proposal to close KSS.
While the chart convinced some, if not many, people that KSS needed to be closed, the newspaper did pointed out the main argument used to justify school closures. The newspaper should be commended for having printed this chart. Hopefully, charts will be clearly explained and used more often.
1) All the charts in the Matrix Report should be revised to include all years since 1983, with tables in the Appendices, as well as .csv downloads online.
2) The QSD board should ensure that a revised chart for all years since 1983 be presented on the front page of the local newspaper with a comparison to Chart #1, and a notice describing the differences.
3) The QSD board should ensure that a revised chart with the actual enrolment be printed annually on the front page of a local paper.
4)  Figure 6 in the final report (p. 18), should be renamed "Enrolment Forecast for 15 Selected Schools Excluding International Students" to replace the title "Enrolment Forecast for All QSD Schools".
#1. Historical enrolment since records were kept was difficult to provide (but is still of interest); therefore, numbers were requested for the years since KSS first opened, 1983. This was provided in mid November 2010; however, the labels were different for different years. A request was made for clarification. An explanation was provided in January 2011. Further clarification is being requested.
#2.
The 2010 forecast for the selected schools, excluding International Students was 4,255, slightly higher than the actual enrolment of 4,236 students. The consultants report mistakenly had the 2010 actual number at 4,411, likely a typo, or a copy and paste that extended values rather than a formula.
#3. For those of you who were able to make it out the Info Sessions, recall I asked for clarification about the numbers for 2010, and as mentioned we all make mistakes, we just want to be clear so that we can fix them. The actual enrolment for the selected schools, excluding International Students, was 19 students lower than the forecast.
#4. The average difference was calculated using the years 2004 to 2010.
Since there are so many topics to address regarding the Qualicum School District Facility Review, many concerned citizens began asking many questions, in an effort to understand the challenges and to help find alternatives to school's permanent closures. Since the responses from the QSD admin staff were slow in coming, people have taken the initiative to share information and findings. Thus began the QSDFR Information Sessions.
here are some of the questions requested that have yet to be answered by the QSD staff:
1) Could we see the enrolment by grade for Kwalicum Secondary School and Ballenas Secondary School since 1983.
and also, since utilization rates are used to determine funding,
2) could you please provide the historical capacity estimates for schools in this School District for as far back as records have been kept.
In a reuters.com business news interview with Nouriel Roubini, who is well known (among economists) for having forecast the global financial crisis, stated the importance of looking at historical information.
He suggests that the reason many did not forecast properly is due to a lack of institutional memory, .... current traders don't remember the downturn in 2001 never mind the downturns in late 1990s, mid '80s and in the 1970s (which were of course followed by upturns).