Article Summaries, present to past
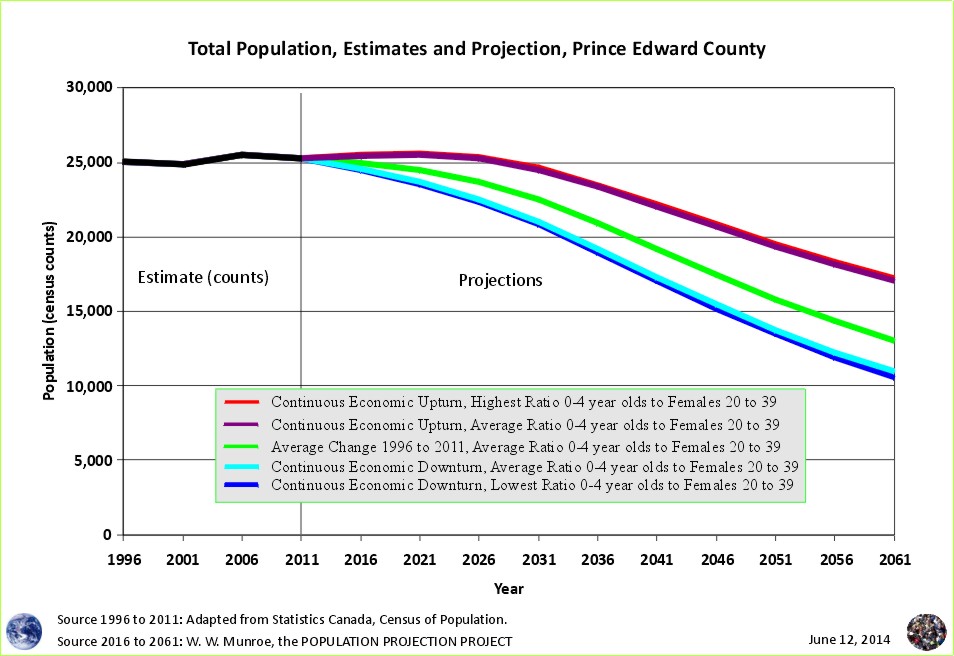
Greener Pastures, But Where's The Help? A Look At One Of Ontario's Retirement Areas, Prince Edward County
June 14, 2014
Will there be enough young adults to meet the demands of the rising elderly population? Let's take a look at picturesque Prince Edward County on the north shore of Lake Ontario, outside of the high commuter flows of Toronto, with about the same population size as Canada's oldest community, in terms of median age, the Parksville Census Agglomeration.
Read more ....
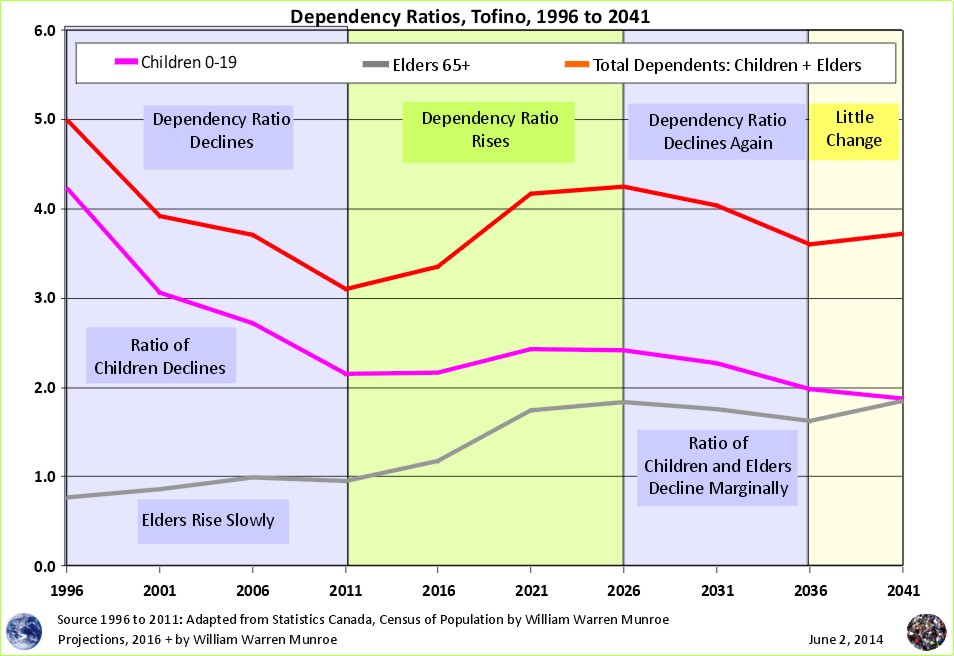
Dependency Ratios for Tofino and Ucluelet
June 12, 2014
What do Alberta and the west coast municipalities of Tofino and Ucluelet have in common? They are attractive to young adults with fewer children resulting in lower numbers of dependents relative to those of working age. But what about the baby boomers retiring?
Read more ....
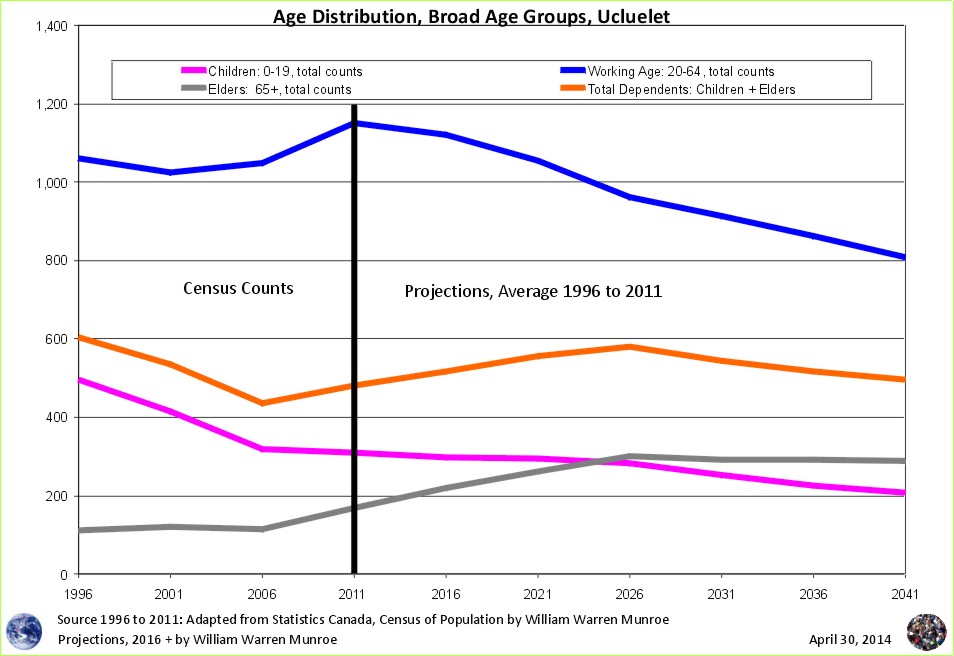
Broad Age Group Changes in Tofino and Ucluelet
June 11, 2014
Two substantial changes between 1996 and 2011: For Ucluelet, children (0 to 19 years of age) decline by ~40%; for Tofino, number of working age (20 to 64) doubled. The result? A brief lowering of the number of dependents relative to those of working age.
Read more ....

Outdoor Recreation to Family Formation in Tofino and Ucluelet
June 4, 2014
How attractive are Tofino and Ucluelet for males and females by age?
Read more ....

From Resource Extraction to Tourism and Accommodation - Ucluelet's Changing Demographics
May 9, 2014
Ucluelet looses population and resource extraction jobs and people from all age groups only to be followed by years of attracting more and more young adults, and children.
Read more ....
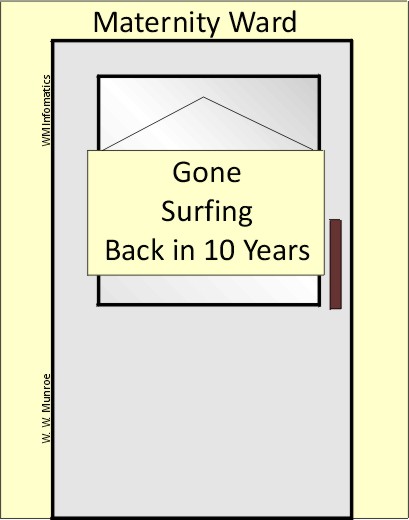
The Sign On the Maternity Ward Door says "Gone Surfing"
April 7, 2014
For many young adults, small towns are unattractive - 20 to 29 year olds get out of town, rapidly, in favour of education, employment and social opportunities in larger population centers.
Bucking this trend is Tofino, on Canada's West Coast, a small town very attractive to young adults, many moving out of large population centers in favour of living closer to the wild, wide spaces and surfing.
But while the number of females 20 to 39 years of age has doubled from approximately 220 to 435 since 1996, the number of children under 5 rose by approximately 15.
Read more ....

Disclosure Of Methods Report Considered Harmful
March 30, 2014
The Qualicum School District's last facility review in 2010-2011 included BC Statistics' false reporting of methods used to create population numbers. The method provided by BC Statistics did not show that BC Statistics used the change in the number of telephone lines as an indicator of population change, nor the many other influences on the final numbers. For this most recent facility review, 2013-2014, methods were simply not provided. Requests for the methods were met with accusations of "conspiracy theorists".
Help safeguard the integrity of population projection numbers used to justify public policy making by insisting on well-defined scenarios based on current demographic trends that can be verified and reproduced.
Read more ....

Why Open Schools When Enrolment Is Declining and Close Schools When Enrolment Is Increasing?
March 25, 2014
Recall in 2010, just 7 years and 1 month after opening a $9.1 million expansion in 2003, the Qualicum School District recommended permanently closing the $9.1 million expansion along with the original high school.
Having served as the Population Analyst for BC Statistics from 2002 to 2006, I continue to advocate that correct methods must accompany findings. Be sure to get clear explanations of how forecasts used to justify opening and closing schools are made.
Read more ....

VIHA forecasts 30% total population increase while the Qualicum School District Superintendent forecasts 0% increase for school age children.
March 18, 2014, (with chart added March 25)
Medical Health Officer for the Qualicum Local Health Area, Dr. Hasselback presented a chart showing a 31% increase in population by the year 2030 - from approximately 46,500 to 61,000 an increase of 14,400 people.
On the other hand, Rollie Koop, Superintendent of the Qualicum School District is prepared to close 4 schools based on a forecast (without providing the reasoning) of 0% increase in persons of school age to the year 2027.
Read more ....

Qualicum School District Has Not Considered "Future Enrolment Growth In The District Of Persons Of School Age, Persons Of Less Than School Age And Adults"
March 17, 2014
When schools are recommended for closure, a public consultation is required to ensure "a fair consideration of the communitys input and adequate opportunity for the community to respond to a boards proposal to close the school permanently", as well as to ensure fair consideration of "future enrolment growth in the district of persons of school age, persons of less than school age and adults".
Public consultation participants have a choice, use open transparent, well defined projections.

Superintendent of Schools Considers Questions About Enrolment Forecast To Be Disrespectful
March 14, 2014
Newly appointed Superintendent of Schools, Rollie Koop, dismisses requests for the assumptions behind new lower enrolment forecast claiming community members who ask are "disrespectful".

The Difference between Projections and Forecasts
March 12, 2014
What is the difference between projections and forecasts?
Open, published methods and data used to create well defined scenarios, versus pretending to foretell the future

The Population Projection Project allows numbers to be verified and reproduced
March 4, 2014
For projections that are valid (can be validated) use the Population Projection Project.
The Population Projection Project is an open, public reference to be used when considering the future enrolment growth for areas in Canada of persons of school age, persons of less than school age and adults.
Since the Qualicum School District staff and board members are not allowing the public to see the method used to create the new (lower) forecast, be sure to use the Population Projection Project.

Qualicum School District Facility Review. Enrolment Rate of Change
February 28, 2014
Has the enrolment decline bottomed out and is it about to rise again in 2016/17 as forecast in 2010? Or will the enrolment decline more than expected as Baragar foretells?
One way to check is to look at the rate of change in enrolment.
Another way is to look at the enrolment of the students in Kindergarten to grade 5.
See the rate of change and the Elementry enrolment ...

Qualicum School District Facility Review. Is the unfounded forecast pretending to foretell the future?
February 25, 2014
Why is the updated forecast lower that the previous forecast?
Why is the updated method not published?
"Forecasting pretends to foretell the future." (Ivan Fellegi, 1999).
See the forecast comparisons.

Compare projections for Canada - United Nations, Statistics Canada, Cohort Change Ratios
February 14, 2014
Why are Statistics Canada's projections so high compared to the United Nations and the Cohort Change Ratios projections?
Why so different?

Fluctuating Dependency Ratios
January 3, 2014
What does the Sandwich Generation look like? Starting alphabetically with Alberta.
Dependency Swap - From Fewer Children to More Elderly.
Verify Population Projection Numbers
December 4, 2013
In an interview with CTV we discussed 1) The importance of caution when using statistics and 2) What is happening with the enrolment in Central Vancouver Island areas.
Read more ....

Comparison of the number of people residing in BC Coast Census Divisions (Regional Districts).
November 6, 2013
While the north west coastal regions lose population, the Greater Vancouver Regional District received a disproportionaly high population increase between 2006 and 2011
The number of people residing in the southern portion of the coast grew from 2.6 million to over 3.2 million between 1996 and 2011.
See BC Coast Census Divisions (Regional Districts) population proportions.

Comparison of the number of people residing in Canada's Provinces and Territories.
November 5, 2013
Between 2006 and 2011, Canada experienced population changes from east to west but also from rural to urban.
Yet, the increase in population for Alberta and BC, when added together, was less than the increase for Ontario.
See Canadas Population proportions.

Population Changes in the Penticton Census Agglomeration
September 25, 2013
The Penticton CA was less attractive to retirees between 2006 and 2011 with more out-migration and death than in-migration for those 60 to 69 years of age.
The number of those 30 to 45 years of age has dropped by 30% since 1996 while the number of young adults (20 to 29) stayed relatively stable.
Read more...

Population Projections for Parksville Census Agglomeration
September 22, 2013
Population declines may happen around the year 2026 for much of the census agglomeration. But Qualicum Beach may be experiencing declines earlier. If so, those born this year will be 8 years old when the declines come. What might it be like?
Read about "6 Population Projections for Parksville Census Agglomeration"...
Presentation to the 2013 Congress organized by the Federation of Humanities and Social Sciences
June 6, 2013
Guess who was in the audience at my presentation "Population Projections for Community Members" - the people from BC Statistics who, after I raised concerns about the non-statistical and substandard methods and models (including using the change in telephone landline hookups as an indicator of population change), accused me of not being able to control my behaviour, making my co-workers fear for their safety and had me dismissed for insubordination, with Vince Ready endorsing the block to arbitration into the real matters in dispute. What a bunch.
When I described the need to verify Official Population Projections, showing the audience of Demographers from around the world, how BC Statistics falsified methods and population numbers, the people from BC Statistics turned darker and darker shades of red.
"We found that the methods provided by BC Statistics to community members
and to Statistics Canada were not the methods used to create population numbers."
Why Verify Official Population Projections

A Comparison of Population Projections for BC
March 21, 2013
With fertility below replacement (less than 2 children per female), the 'boomers' ageing, and mortality increasing rapidly, why is the BC government population projection 'up and to the right'? Why do BC government interprovincial migration projections scenarios not include negative net migration?
Government population projections for BC reflect an "up and to the right" aspiration, while the cohort change ratios method shows BC's population growth slowing, and leveling out. Read a "A Comparison of Population Projections for BC"...

G8 Nations Population Projections and Economic Activity
February 12, 2013
Declining population is considered by some to be beneficial for "the environment". On the other hand, declines are considered by some to be detrimental to economic activity. Is there a way to maintain or improve quality of life and prosperity as population growth slows, levels out, or declines?
Read more ...

Population projections for Parksville Census Agglomeration to 2041
November 23, 2012
Parksville Census Agglomeration is one of the oldest, in terms of median age of residents, regions in Canada. What does the future look like?
While deaths continue to increase and births stay relatively low, below replacement, population can only increase with even more in-migration than out-migration.
Read more ...

Population projections for Qualicum Beach to 2041
November 20, 2012
With deaths exceeding births by nearly 6 times (600%) and rising, will the fluctuating migration keep the town's total population from declining?
Read more ...

3 population projections for Canada are compared: the United Nations, Statistics Canada, and WM Population Analysis
October 22, 2012
WM Population Analysis methods provide similar population projection (medium scenario) with the United Nations
Read more ...
, for Canada, provinces and territories")
Couple families by presence of children in private households, 2011 counts, children (under 24 years of age), for Canada, provinces and territories
September 19, 2012
Percent of census families with children (under 24 years of age) at home declines.
Read more ...

Population Analysis of the Nanaimo Regional District
August 15, 2012
Population analysis of the Nanaimo Regional District with age / sex distribution projection to 2041 (new improved animation added September 22, 2012).
Read more ...

2011 Census Counts versus Projection for Parksville CA
June 13, 2012
Short term population projection comparison with the 2011 Census counts.
Read more ...
Should Local Parents Question Official Statistics?
June 12, 2012
Some people are saying that a local News Editor attempted to discredit a local parent for "questioning official numbers". What do you think? Did the parent, who asked for enrolment numbers since the school (proposed for closure) was first opened, lead community members including the Mayor astray?
Read more ...

Canada, Age Distribution, 1996, 2001, 2006, 2011 Census Counts
May 30, 2012
Fluctuations in Canada's Age Distribution create a challenge for those dealing with Community plans.
Read more ...

BC, Age Distribution, 1996, 2001, 2006, 2011 Census Counts
May 29, 2012
The large shifts in age distribution highlights the dynamics of BC's changing population.
Read more ...

Participation in Global Knowledge Economy starts Locally
April 18, 2012
Communities that encourage public consultation, scientific inquiry, the exchange of information, thoughtful discussion, and engage students, young and old, in local issues are both better informed and better able to participate, and gain high paying jobs, in the growing global knowledge economy.
Read more ...

BC's Annual Net Interprovincial Migration is negative for the first time since 2002
April 6, 2012
Alternatives to resource extraction, refinement, and services for tourists and retirees, such as high paying jobs in the global knowledge economy may provide opportunities that reduce the fluctuations in economic activity.
Read more ...

Nanaimo Regional District Population and Dwelling Counts, 2006 to 2011
March 15, 2012
There were only an estimated 1.7 people per each of the additional private occupied dwellings.
Read more ...
")
The population counts for the census subdivisions surrounding the Central Salish Sea
February 20, 2012
There were modest population count increases for some csds, and modest decreases for others. Overall, approximately 3,000 more people were counted in 2011 than were counted in the 2006 census.
Read more ....
")
Population change varies for BC's Regional Districts between 2006 and 2011
February 8, 2012
Southern RDs had population increases while the North experienced declines. See the
map of the percent population change for BC RDs between 2006 and 2011.

Is it true, does Statistics Canada consider BC Stats' population estimation methods to be of "better quality"?
January 27, 2012
However, Statistics Canada's Demography Division says that BC Stats' did not consult with the Demography Division regarding BC Stats use of the change in telephone landlines hookups to estimate population change.
Read more... This link goes to another site.

What to Look For in the 2011 Census
January 8, 2012
Population Signatures comparing changes in age distribution with previous census years can reveal important information about the change in number of people by age and sex for communities, towns, cities, regions, and provinces.
Population Signatures can provide relevant information when considering school openings and closures.
Read more...

BC Population Change, 3rd Quarter, 2011
December 22, 2011
Not since 2001, has BC's summer time net interprovincial migration been negative. For the third quarter in a row, more people moved out of BC, to other places in Canada, than moved in.
Read more ...

BC Population Change, 2nd Quarter, 2011
October 1, 2011
Preliminary population estimates suggest BC's economic bust continues. For the second quarter in a row, more people moved out of BC, to other places in Canada, than moved in.
Read more ...
SUCCESS AT LAST! Now, BC Stats Must Allow Verification of Population Numbers.
September 22, 2011.
After 13 years, the BC provincial government Official Statistical agency, BC Stats, under new management, has revised the population estimation methods paper. Why were the many changes to the population estimation model after 2001 not made public?
The substandard population estimate and forecasts methods (kicking out outliers to reduce error, adopting the change in telephone landlines as an indicator of population change etc.) influenced decision making regarding the opening and closing of public, and private, facilities including health and education facilities. Since 2001, nearly 200 public schools have been closed in BC.
During this "dark" period in BC's Statistics Agency, particularly after 2001, while Don McRae was Executive Director and Dave O'Neil was given a Director position over the Population Section (4 people) many changes were made to the way population numbers were created, including changing numbers outside of the models.
Rather than inform taxpayers, clients, parents and guardians, and Statistics Canada of the changes, BC Statistics and the Ministry responsible provided incorrect methods and numbers.
Read more ... with link to a letter to the new Provincial Statistician & Executive Director, BC Stats, Ministry of Labour, Citizens' Services and Open Government, Angelo Cocco.
Population Geography and Demography, Similarities and Differences
August 2011
Some Demographers still look at migration as a residual. Population Geographers help illuminate "in" and "out" migration, by age and sex, providing insight into changes in social and economic activity.
Read more ...
Open Data Education portal/website: Verification and Reliability
July 19, 2011
The government is opening up access to information, but is it reliable?
Read more ...
BC Population Change, 1st Quarter, 2011
June 22, 2011
Interprovincial migration negative once again. Not since 2003, have more people moved out of, than in to, BC.
Read more ...
InterProvincial Migration, Net, BC, 1971 to 2010, (July 1)
May 2011
Boom and Bust economic cycle comparison.
Read more ...
Quarterly BC Population Change for 2010: Net International Migration is negative in the last quarter of 2010
April 2011
With the decline in fertility and increase in deaths, fluctuations in net migration could mean the difference between population growth or population declines for BC. In the last quarter of 2010, net interprovincial migration continued to decline while net international migration was negative.
Read more ...
BC Population Change, Regional Districts, 2009 to 2010
February 2011
Here you will find the descriptions of the factors of population change, including natural changes, (births minus deaths), as well as net migration (interprovincial and intraprovincial) for BCs RDs for the year from July 1, 2009 to June 30, 2010.
Read more ...
BC school closures need independent reviews
January 2011
An examination of the data used to justify the recommendation to close the only high school in Qualicum Beach BC highlights the importance of communities / tax-payers having access to information. Here is a summary of the author's Information Session presentations.
Read more ...
Royal Society Call for Evidence, the strengths and weaknesses of different population modeling methodologies
October, 2010
People and the Planet: Call for evidence. Compare BC Stats and Statistics Canada's methods and models to estimate population to the regional level.
This is a unique opportunity to compare two Official Statistical Agencies providing
population estimates at the regional level.
Read more ...
Parksville Census Agglomeration Population Projections, June, 2010
What will the age distribution look like in 2016?
Read more ...
Population Compendium, June, 2009
Why is distribution of the Annual Demographics Compendium being restricted?
Read more ...
2008 Population Change, BC, April 2009
Boom time comes to an end again. How long will the down turn last?
Read more ...
2008 Annual Demographic Estimates: Subprovincial Areas, not published, March 2009
Why hasn't Statistics Canada's released the Annual Demographic Estimates: Subprovincial Areas numbers? Take a
look and you will see that there is no output posted in late January or early February 2009 for estimates dated 2003 to 2008.
Which Country Won the Most Medals per Population at the 2008 Summer Olympics? September 2008
This article examines the number of medals won by countries relative to the total population, and whether population density makes a difference.
Read more (html)... ,
(pdf)
BCs Boom and Bust Economy, 1978 to 2006, August 2008
Does BC still have a boom and bust economy? How do we measure boom and busts? Understanding economic cycles, and what interrupts them, helps refine decision making.
Read more ...
Income and Housing: Urban/Rural Differences/Similarities, June 2008
Housing similarities between largest cities and distant North. Article in Beacon.
Read more ...
School Age Population Change in BC and Canada, 1971 to 2007, May 2008
The 2001 census results showed that in Canada, the number of children under 5 years of age declined by 221,545, between 1996 and 2001, almost a quarter of a million fewer children. The much anticipated 2006 census revealed that between 2001 and 2006 the population decline for those under 5 slowed considerably to just 5,745 fewer children. What does the population change look like for BC. Article in Beacon.
Read more ...
Immigration and Labour, April 2008
The Minister of Citizenship and Immigration can now admit whoever and how many ever people she/he wants to come into Canada.
Read more ...
Migration to the Nanaimo Regional District, March 2008
The 2006 Census mobility release provides an estimate of the number of people 5 years of age and older who moved between Census Divisions in Canada (Regional Districts in BC) between 2001 and 2006 (20% sample). The Nanaimo Regional District (RDN), on the east coast of Vancouver Island, is attractive to people in Canada for many reasons including it's relatively warm climate.
Read more ...Map of Migration to the Nanaimo Regional District 2001 to 2006, March 2008.
Map of internal migration (within Canada) to the Nanaimo Regional District between 2001 and 2006 (20% sample).
Read more ...
Aboriginal Identity Reflects Maturing Society, February 2008
Acceptance and cooperation promoted by people of mixed European and Aboriginal ancestry helps make Canada a healthy society. Article in Beacon.
Read more ...
Global and Local Population Change, January 2008
How does Parksville/Qualicum reflect global population change? It leads Canada as an aging population...something the rest of Canada will go through over the next thirty years. Presentation to Parksville and Qualicum Beach Chambers of Commerce.
Read more ...
Migration, 2006 Census release, December 2007
Canada is a nation of movers. BC has more residential mobility then Canada as a whole, and the Parksville Census Agglomeration (Oceanside) has even more. The Parksville CA can be characterized as a high turn over community. What does that mean? Weaker social networks and greater reliance on public and privates services.
Read more ...
Central Vancouver Island, 2006 Census Age Distribution, August 2007
Add to the oscillation in age distribution, the boom and bust nature of a resource based economy, and variations in migration for people of different age groups, Central Vancouver Island is far from a stable community but rather can be best described as a dynamic, fluctuating, high turnover region.
Read more ...
Population Change in BC between 2001 and 2006, April 2007
The "Boom" time varies across BC, highlighting the end of population expansion and the beginning of contraction.
Read more ...
Migration between Core and Peripheral Areas, 2005
Fundamentals of booms and busts in economic activity (written while employed as the Population Analyst - BC provincial expert on migration).
Read more ...
Where do the Children Play, BC, Canada, 2005
Migration of females of reproductive age in BC (written while employed as the Population Analyst - BC provincial expert on migration).
Read more ...(pdf)
Intraprovincial Migration, 2004
A closer look at migration between Core and Periphery (written while employed as the Population Analyst - BC provincial expert on migration).
Read more ...(pdf)
Spheres of Influence, April 2000
Testing Alternative Indicators of Social and Economic Integration used to delineate Census Metropolitan Areas / Metropolitan Influence Zones (self-directed graduate studies project with the Geography Division of Statistics Canada).
Read more ...
Infant Mortality Rates, December 1999
Model to interpret variations in Infant Mortality. Defence spending versus education as well as Urban / rural interactions are used as indicators to juxtapose Will versus Reason as well as Structure in relation to Processes. An interaction effect is found where infant mortality rises rapidly where defence spending is high in counties with a high proportion of rural dwellers. These indicators explain ~80% of the variation in IMR (graduate level statistics course term project).
(Read more ...pdf)Reference from Professor T. A. Nosenchuk, Ph.D. (teacher in the love of wisdom).
(Read more ...pdf)
Back to Top
